 |
 |
 |
|
|||||||||||||||||||||||||||||||||||||||||||||||||||||||||||||||||||
|
|
|
|
|
|---|
Presented with Brian Lloyd, WB6RQN at the River City Amateur
Radio Communication Society meeting
Sacramento, California, March 1, 2011.
Others2-9 have written about
experiences using the WSPR network as a tool in the
analysis of antenna performance and ionospheric
propagation. Here I will share observations on
comparing antenna performance using WSPR mode.
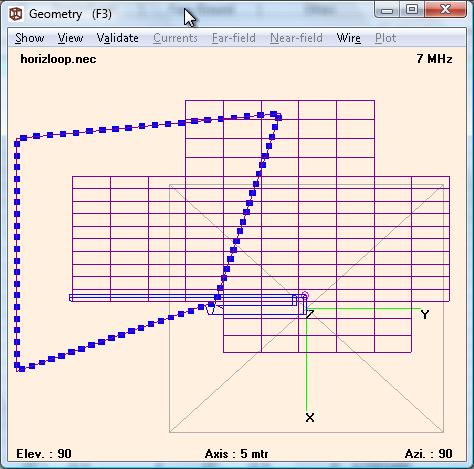
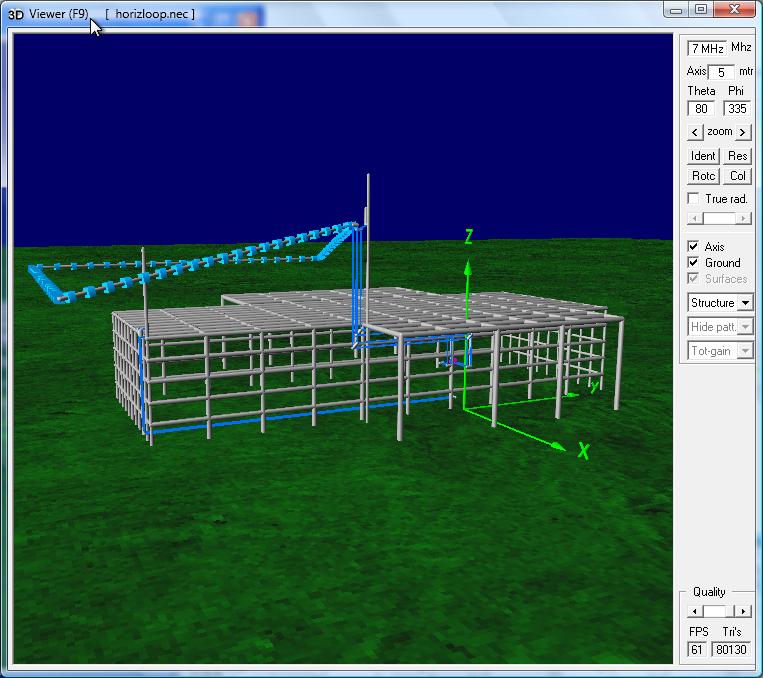
THE COMPARISON STATIONSThe study data was collected from 13 through 20 December 2010. My WSPR station (KP4MD) consisted of a Kenwood TS-140s transceiver operated at 5 watts (37 dBm) output and a full wave 40 meter horizontal loop antenna at an average 5 m elevation above ground (Figs. 1 and 2), described in full detail in "Computer Assisted Low Profile Antenna Modeling II."10 The 4nec2 antenna modeling program predicted mainly high angle radiation with 1 dBi omnidirectional gain at 40° elevation on 7 MHz, and mainly low angle radiation with a null in the vertical direction and 4 dBi gain ±1 dBi at 40° elevation over 30° to 240° azimuth on 14 MHz. |
|
The station was in an urban location in the Sacramento, California area, 40 m from a major thoroughfare and 200 m from a nearby commercial center. The antenna polarization was horizontal and expected to reduce the impact of predominantly vertically polarized local man-made noise. On 23 January 2011, common mode chokes were placed on the transmission line at the antenna feed point and the station window to decrease common mode noise. At 0400 UTC on 3 February 2011, background noise levels at this location were measured as -138 dBm/Hz at 7 MHz and -139 dBm/Hz at 14 MHz.
|
|
|
|
|
|||||||||||||||||||||||||||||||||||||||||||||||||||||||||||||||||||
|
|
|
|
|
|---|
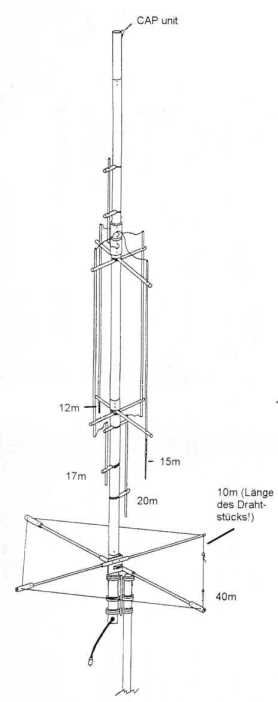
The comparison WSPR station (WB6RQN) consisted of a Flexradio 5000 transceiver operating at 2 or 5 watts (33-37 dBm) output and a Gap Titan DX antenna (Fig. 3). Rohre11 described the Gap Titan DX as an shortened asymmetric elevated vertical dipole with low loss linear decouplers for loading the different bands. Although the manufacturer provides neither gain nor radiation pattern specifications, a shortened dipole is expected to exhibit reduced gain and efficiency as compared to a full length half wave dipole. A vertical dipole is also expected to radiate primarily at low angles with a null in the vertical direction. A study of the GAP Titan DX antenna by Banz12 reported -7.6 dB gain relative to a reference monoband vertical antenna on 7 MHz and nearly 0 dB relative gain on 14 MHz.
The WB6RQN station was located in a suburban residential area 29 km east of KP4MD. The external winter noise level in such an environment is reported in ITU Recommendation ITU-R P.372-713 as typically around -140 dBm/Hz at 7 MHz and -150 dBm/Hz at 14 MHz.
Our relative proximity was expected to provide similar ionospheric signal paths to distant receiving stations. However, environmental noise levels and antenna performance were among the factors expected to produce significant differences in signal to noise ratios on received signals at our respective stations.
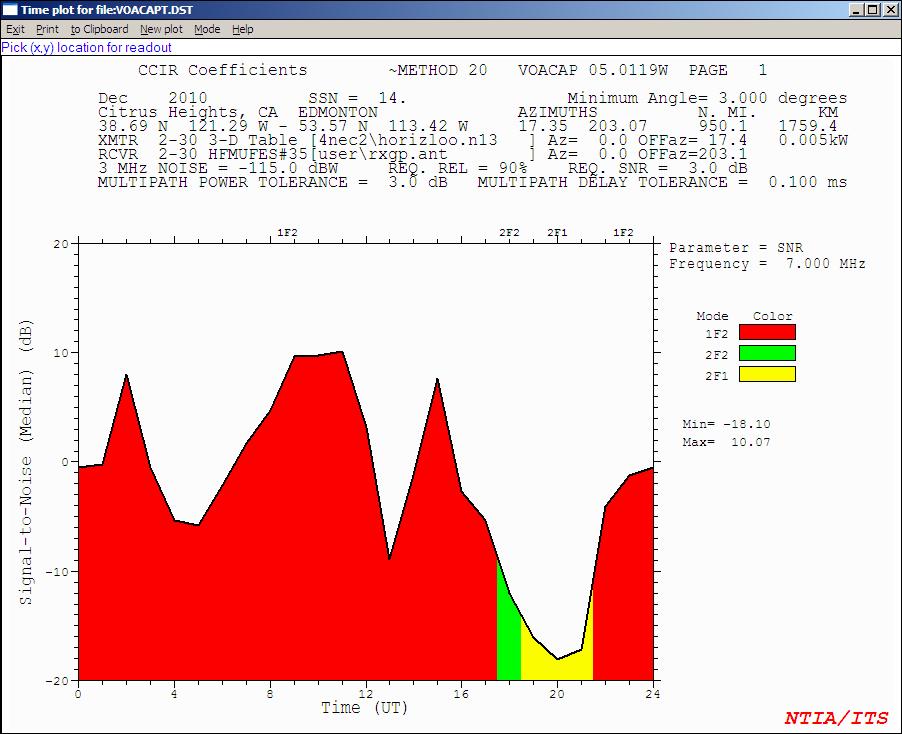
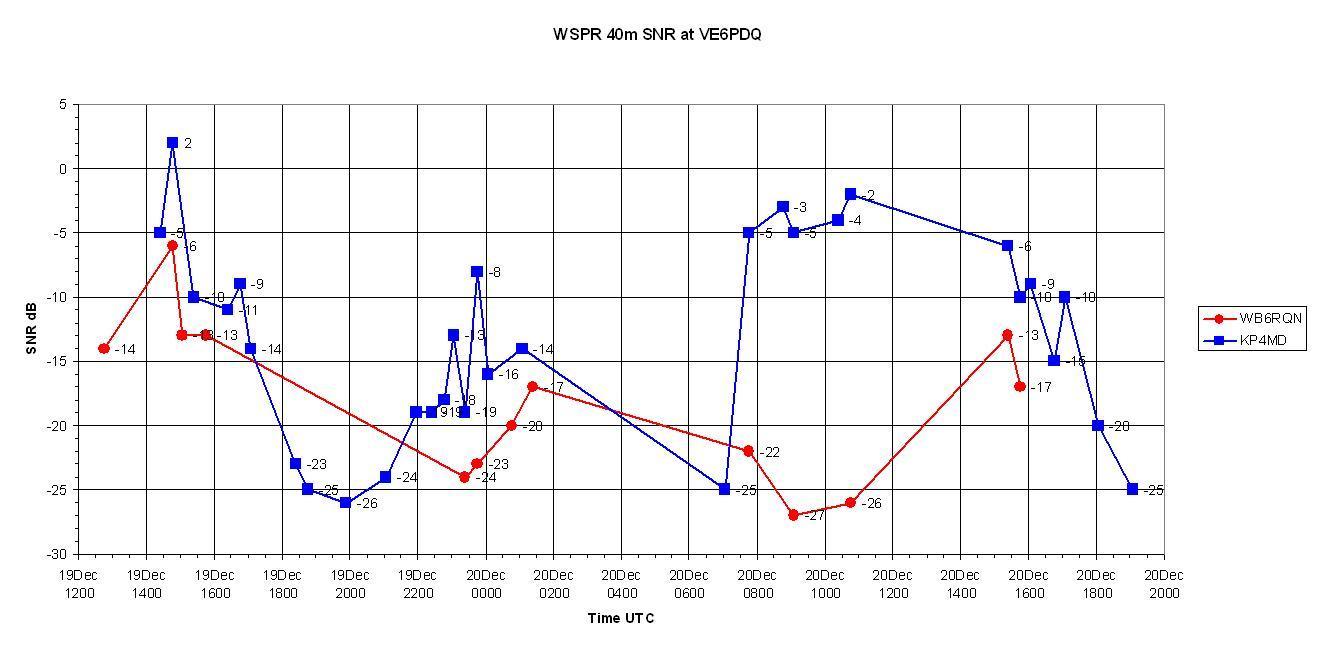
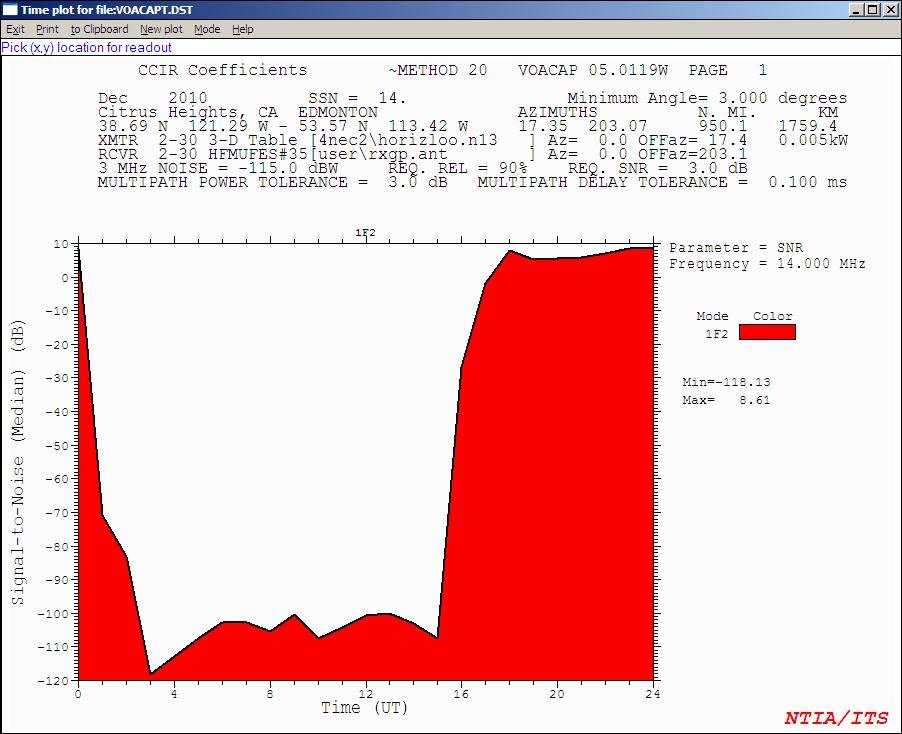
Figure 5 shows signal to noise ratios for the 7 MHz signal path during December 2010 (smoothed sunspot number of 14) between KP4MD and VE6PDQ as calculated by VOACAP14, a freeware ionospheric propagation prediction program. Figure 6 compares the 7 MHz signal to noise ratios observed at VE6PDQ in Edmonton, Alberta from 19 to 20 December, 2010.
 |
 |
|
the Citrus Heights, CA to Edmonton, Alberta path on 7 MHz during December 2010 (SSN=14) |
|
|---|
A correspondence in the trends of predicted and observed signal to noise ratios over time is apparent. The signals peak prominently at 1500 UTC in both charts, followed by a drop in signals centered at 2000 UTC. From 1600-2300 UTC the GAP Titan DX antenna (red line) loses contact while the loop antenna's (blue line) higher radiation angle maintains contact with the double hop F1 and F2 layer propagation modes. Signal strength peaks occur around 0000-0200, 0800-1100, and 1500-1600 UTC separated by corresponding dropout periods. Signal to noise reports for the loop antenna were generally 3 to 6 dB higher than for the GAP Titan DX, except from 0800-1100 UTC when the loop antenna signals were around 20 dB stronger.
Figure 7 compares signal-to-noise ratios of 7 MHz transmissions received from VE6PDQ during this period. The data points cluster around the same times as those shown in Figure 5, with signal to noise ratios at WB6RQN consistently 2 to 6 dB higher at WB6RQN than at KP4MD. If the ionospheric propagation is reciprocal in both directions, this difference may reflect variations in receiver performance and environmental noise levels.
 |
|
|
|---|
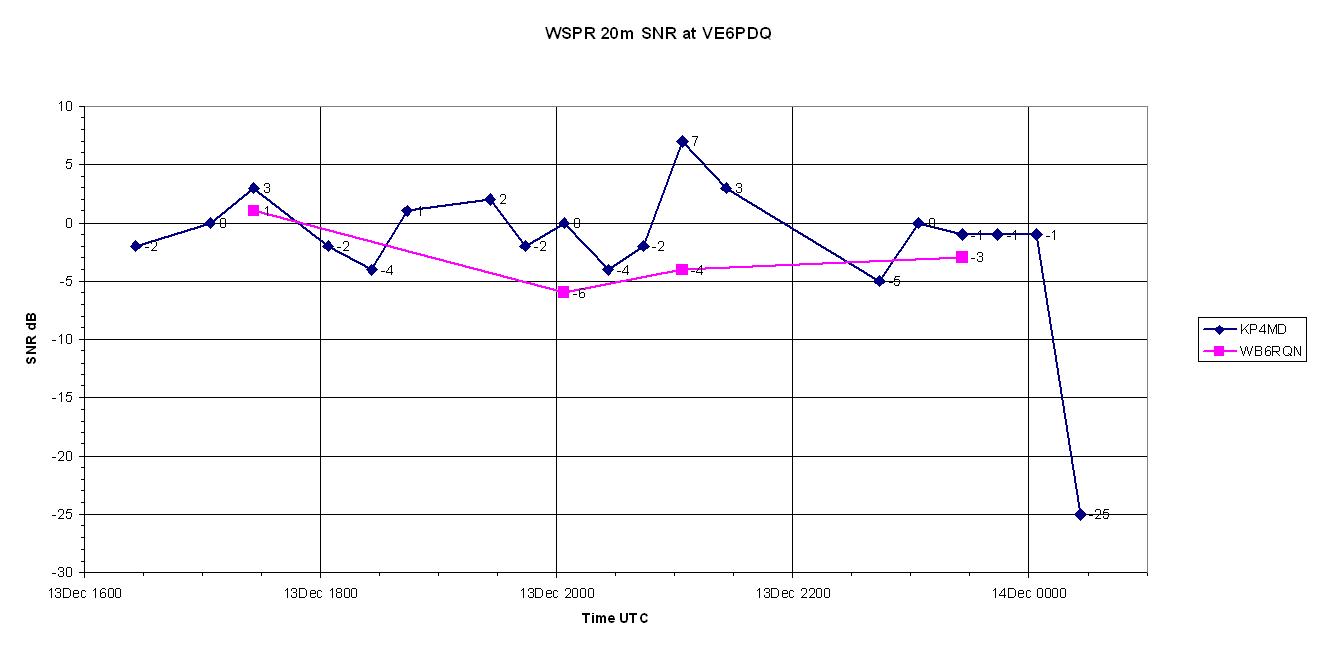
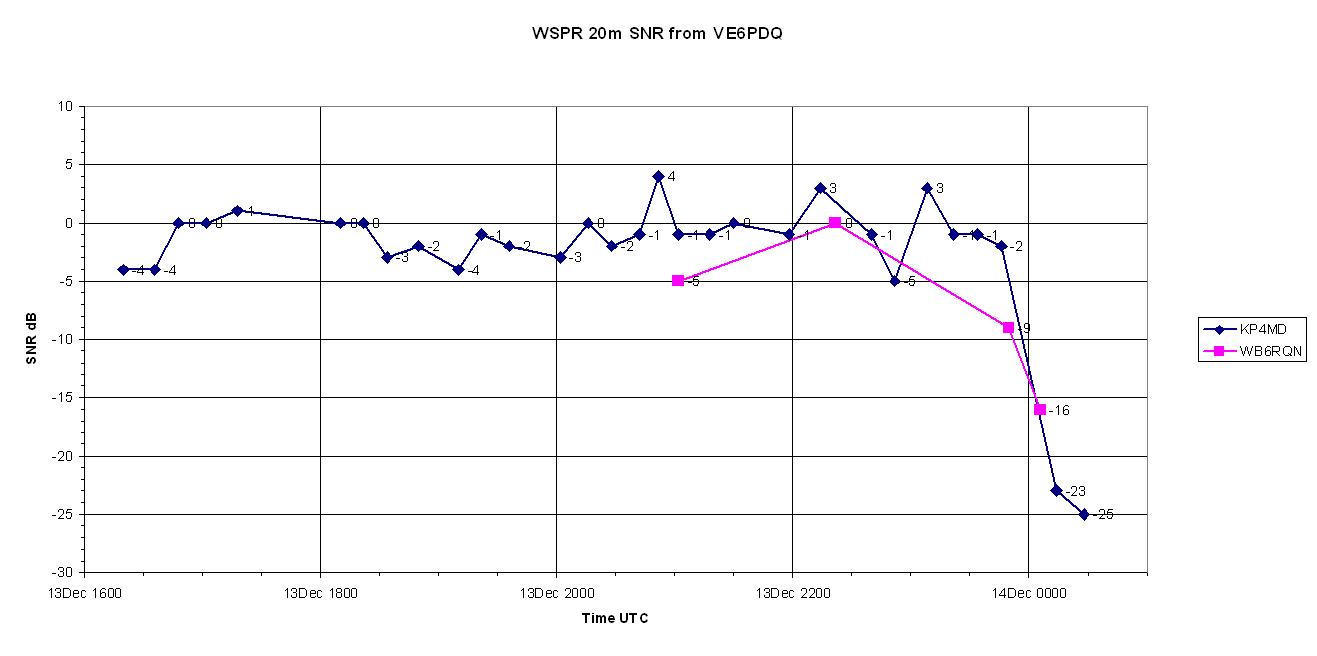
Figure 8 shows signal to noise ratios for the 14 MHz signal path during December 2010. Figure 9 compares the 14 MHz signal to noise ratios observed at VE6PDQ in Edmonton, Alberta from 13 to 14 December 2010.
 |
 |
|
the Citrus Heights, CA to Edmonton, Alberta path on 14 MHz during December 2010 (SSN=14) |
received at VE6PDQ on 13-14 December 2010 |
|---|
Again, a correspondence in the trends of predicted and observed signal to noise ratios over time is seen. Spot reports occur only during local daylight hours from 1600-0000 both in the predicted and observed data. The loop antenna produced signal to noise ratios consistently 2 to 11 dB higher than the Gap Titan DX antenna.
Figure 10 compares signal-to-noise ratios of 14 MHz transmissions received from VE6PDQ during this period. These data also show little variation in ionospheric propagation over the same time period, but with signal to noise reports consistently 2 to 11 dB higher at KP4MD than at WB6RQN. Again, this difference may reflect variations in receiver performance and environmental noise levels.
 |
|
|
|---|