Signals Of Opportunity
The use of Signals of Opportunity for track&trace and the weather
The idea behind this website is to test if ‘DAB’, Digital Audio Broadcasts, can be used for
(1) track and trace (geo - positioning) and as a (2) weather station. It is explained in the paper The use of Signals of Opportunity for the Measurement of Atmospheric Refractivity (R. J. Watson*, C. J. Coleman - link in the sources below).
My Tom Tom GPS in my car died when I updated it. I hate software updates and I really hate it when they corrupt my equipment (damn you, phoebes cartel). So, I decided to try to make my own track&trace system . The weather station was a bonus.
Insights in the DAB network
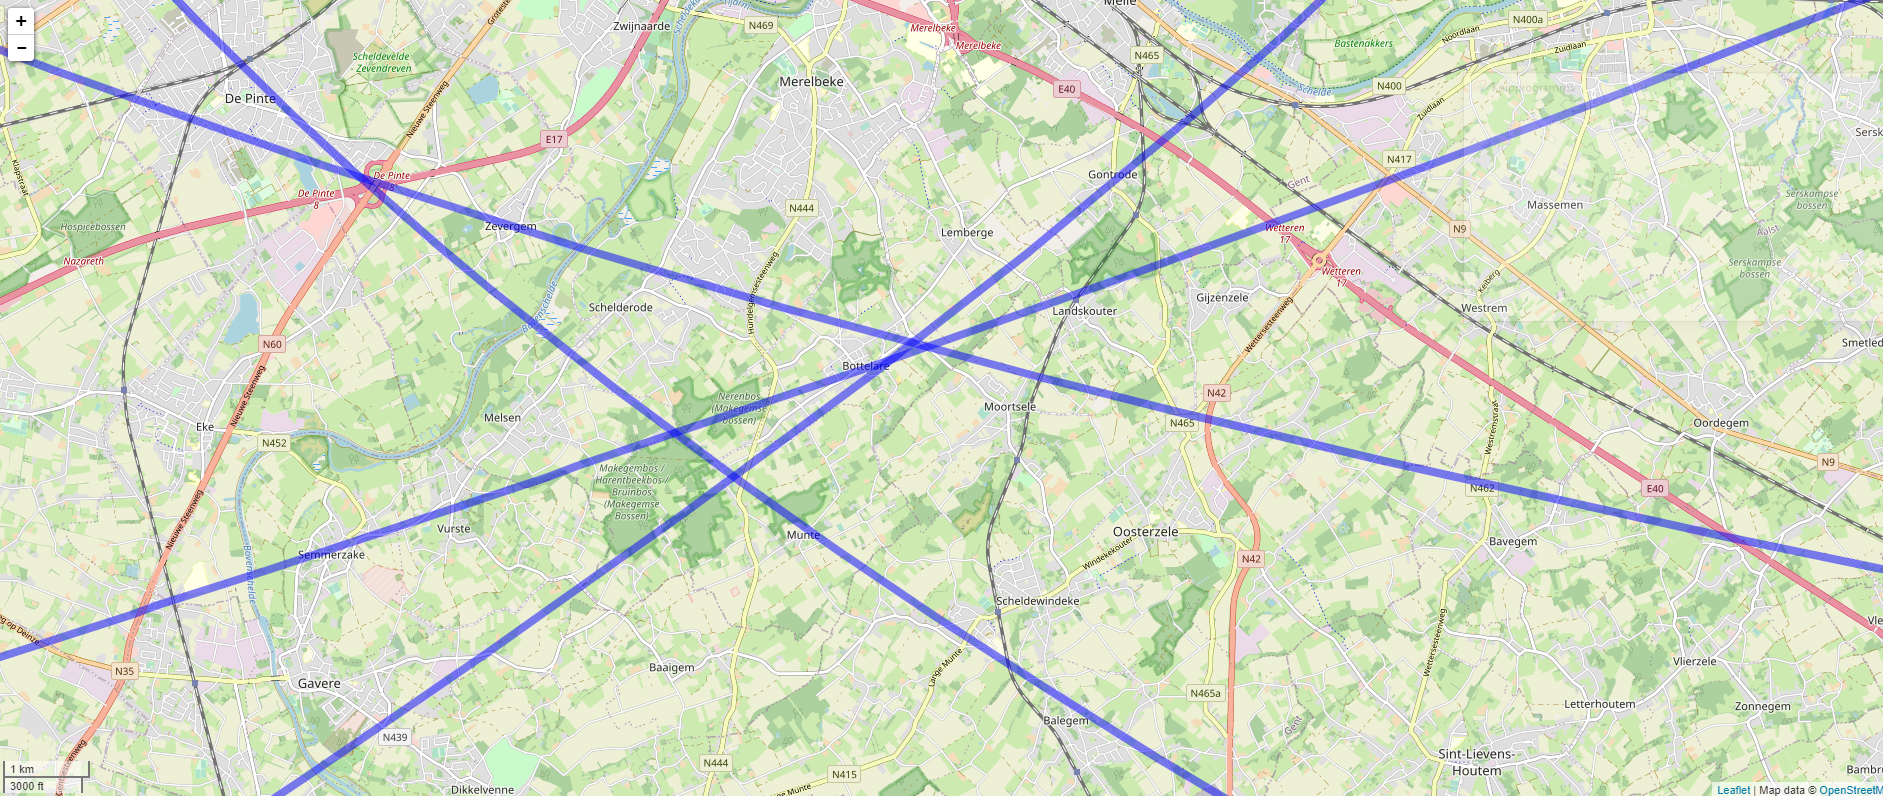
In DAB+ networks, multiple transmitters on different location send the same information on a single frequency. In the tests below, the frequency is 223936001 Hz (DAB channel 12A). This infrastructure makes geolocation possible; My location is near Merelbeke, a city South of Ghent. The surrounding transmitters are located at Ghent, Oudenaarde, Aalst and Tielt - It is shown on the map below.
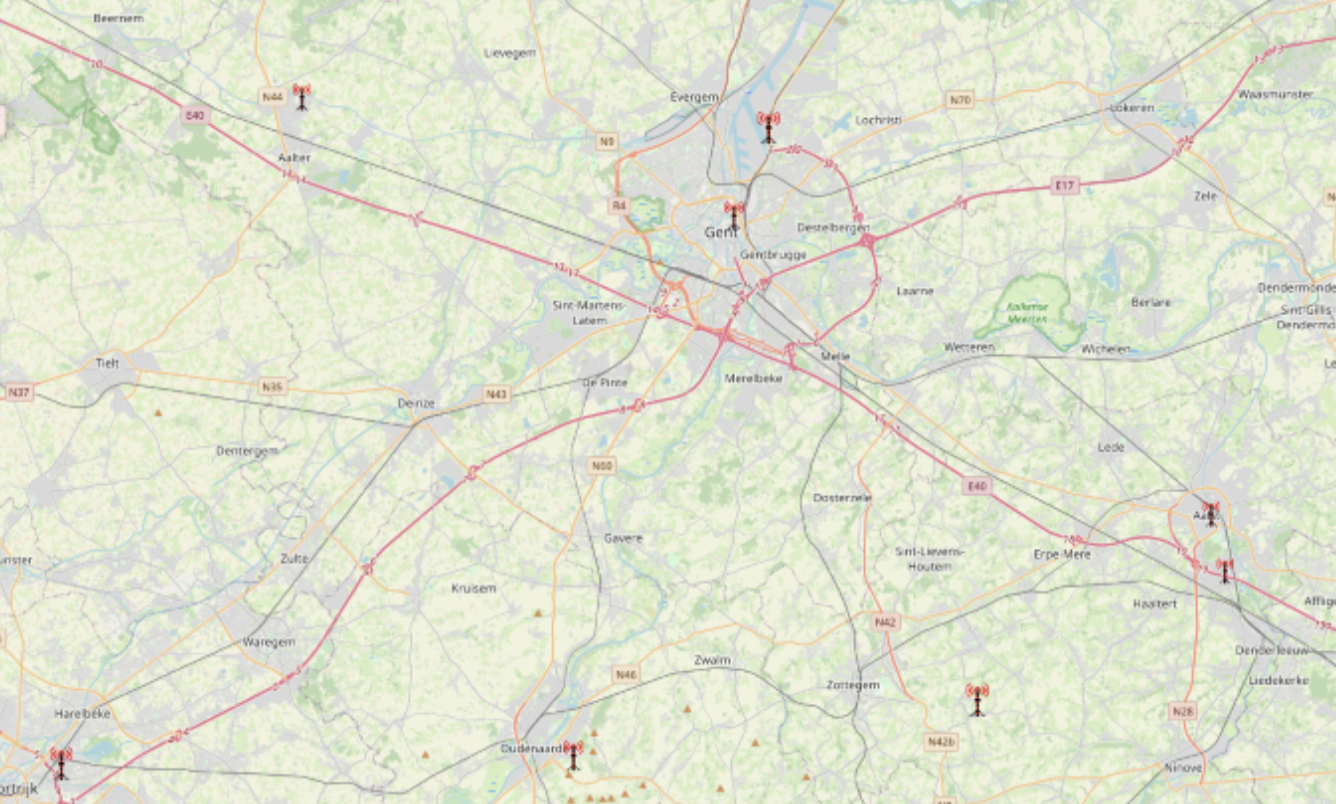
The image is taken from the website FMSCAN that has a map of DAB+ transmitters world-wide.
The following MATLAB/OCTAVE scripts process these samples:
- The first script is ‘geogram’ - It draws the TDOA hyperbola on a map with coordinates of senders and receiver. The intersection of the lines determine the location.A list of DAB transmitters in Belgium is provided in a .csv files. The variables lag1meters, lag2meters, etc… determine the observed lag between the transmitter tx1, the receiver (’home’),and the transmitter txN where N is the reference transmitter.
The name ‘geogram’ is a reference for positional messages - messages you receive at only one place. This idea came from reading about the Internet-of-Persons.
- The second script is ‘findlag’. The script dissects a samples signal and find the autocorrelation lags embedded in the recording.
To measured a DAB signal (channel 12A), use the script below:
rtl_sdr -f 223936001 -s 2048000 -n 4096000 dab-$( date '+%d%m%Y_%H%M%S').iq
Below is a calculation of the receiver’s position relative to the DAB transmitters in the region: Theoretically, If I receive the signal there is a lag of 52.8 samples between the signal of Ghent and the signal coming from Aalst. The same with the signal coming from Oudenaarde (23 samples lag), Herzele (lags 9 samples) and Kortrijk (lagging 153 samples).
Report GentEu<->home<-> AalstE
home tot (tx1) 13945.5199
home tot (tx2) 21624.5047
(tx1 min tx2)7758.9847m 2.6286e-05s peak: 52.8543 samples
Report GentEu<->home<-> Oudenaar
ref tot (tx1) 14945.5199
ref tot (tx3) 17032.4203
(tx1 min tx3)3186.9004m 1.1598e-05s peak: 23.7056 samples
Report GentEu<->home<-> Herzele
home tot (tx1) 13945.5199
home tot (tx4) 15342.8044
(tx1 min tx4)1497.2845m 4.8974e-06s peak: 8.825 samples
Report GentEu<->referentie<-> Kortrijk
home tot (tx1) 13955.5199
home tot (tx5) 35424.2134
(tx1 min tx5)21574.6934m 7.473e-05s peak: 152.9997 samples
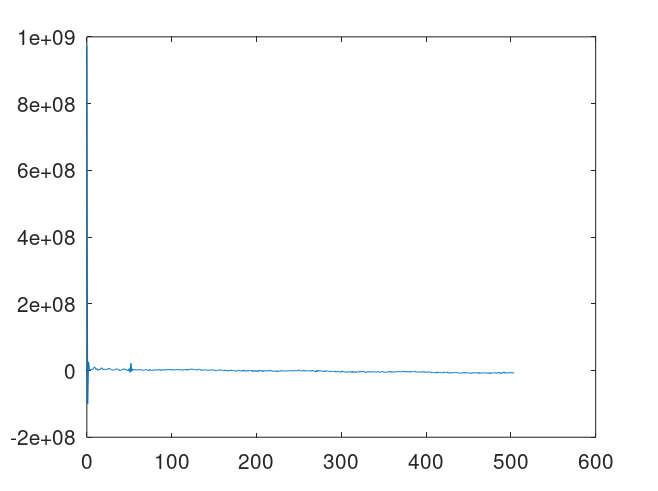
In reality, the signal bounces off buildings, the ionosphere and is influenced by the weather (see next chapters). Thus the ‘calculated’ lag (peak) is only approximated by the observed lag (script findlag).
|
|
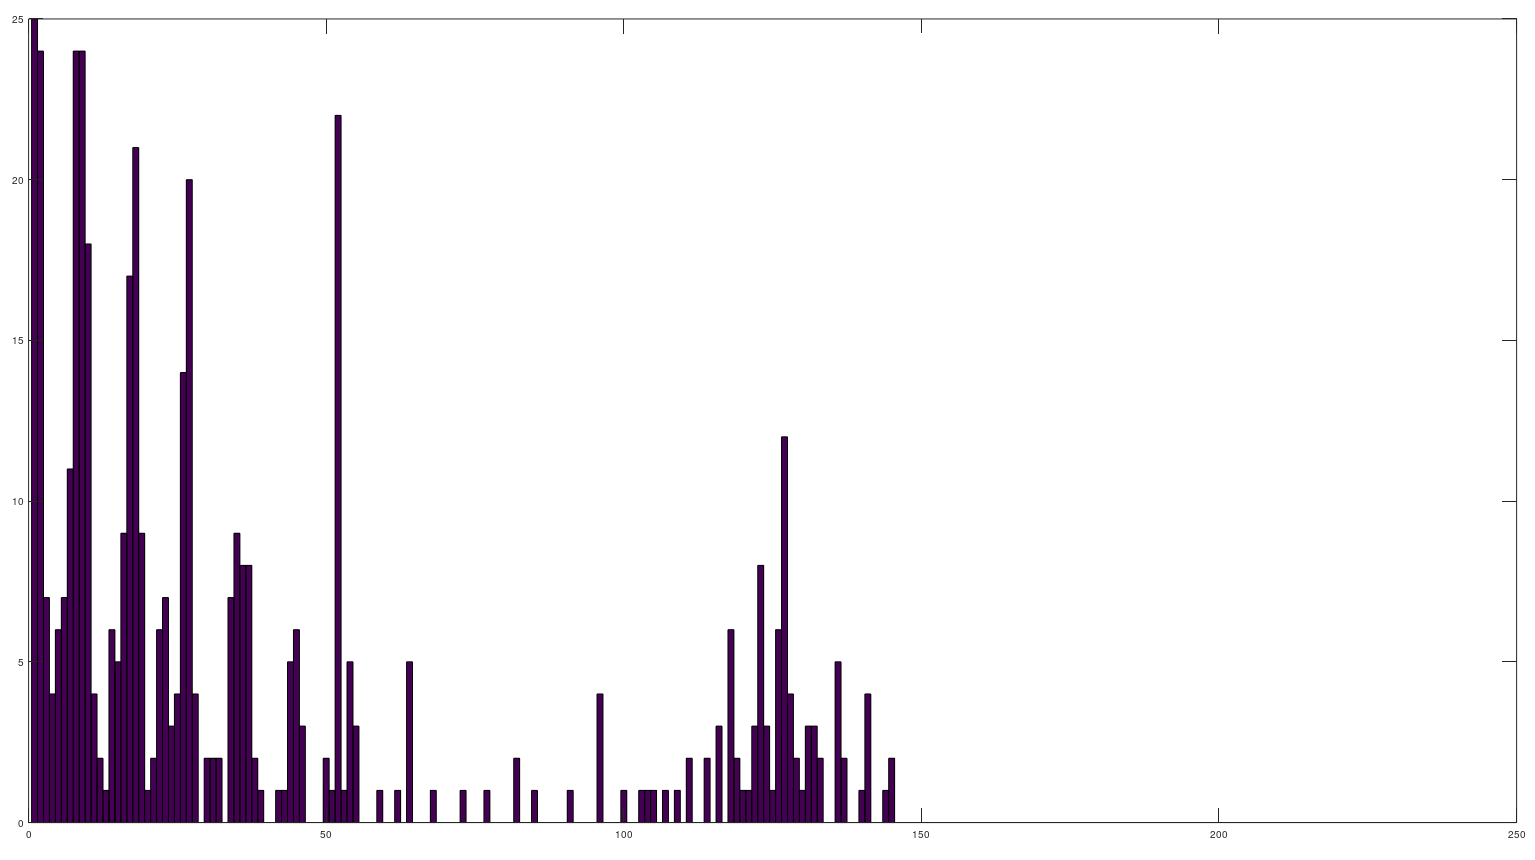
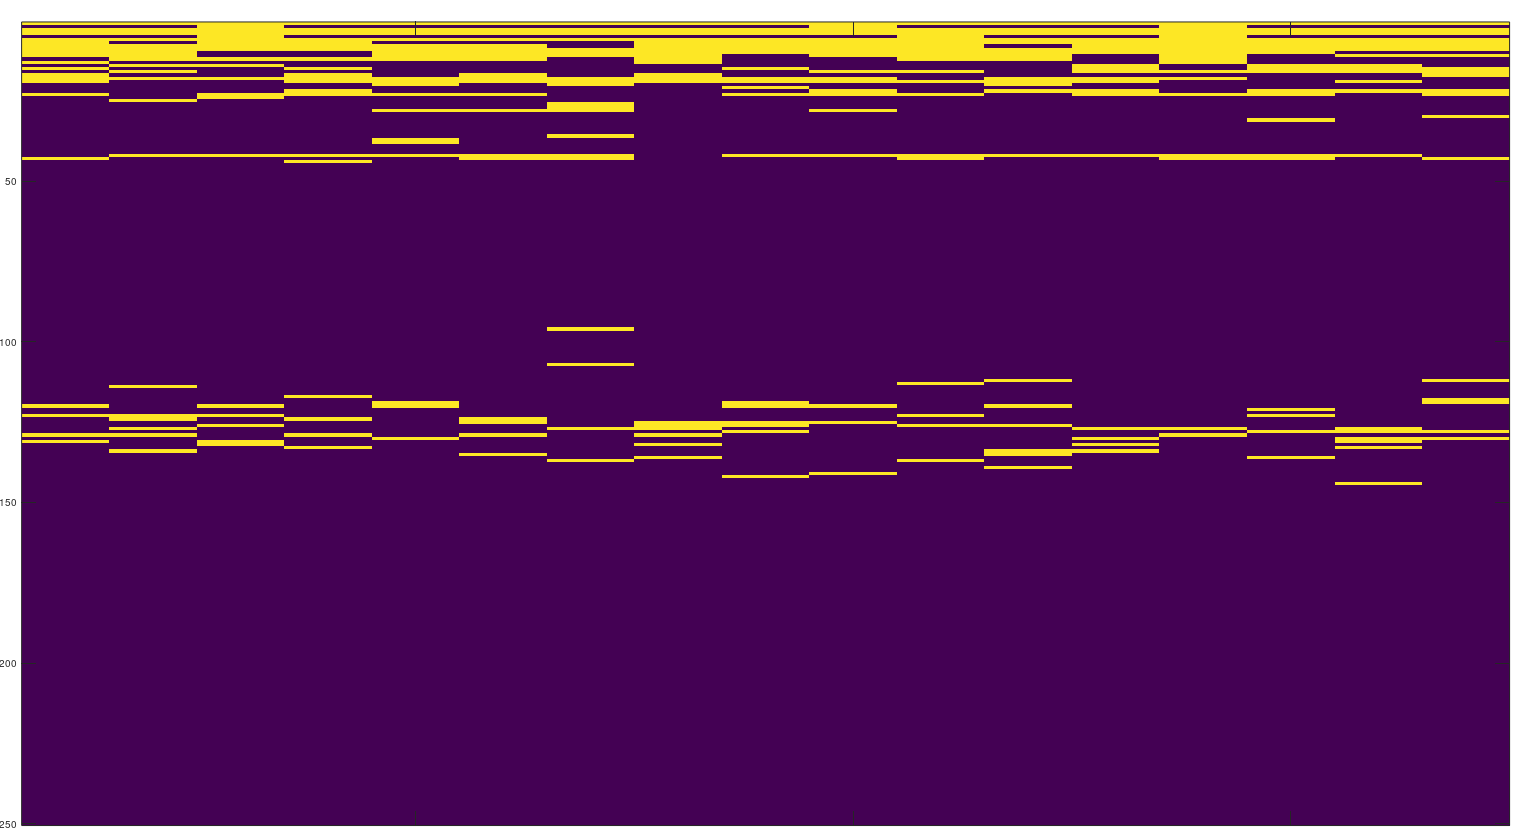
The autocorrelation (image above, left) of the received signals peaks on lag sample 9 (strong signal), 17 (weak) and 52 (very strong) and several lag near sample 117;
Using these lags and the script geogram, the map shows you the intersection of hyperbola and the location of the receiver ; This technique is called TDOA (time difference of arrival). This is shown in the map below.
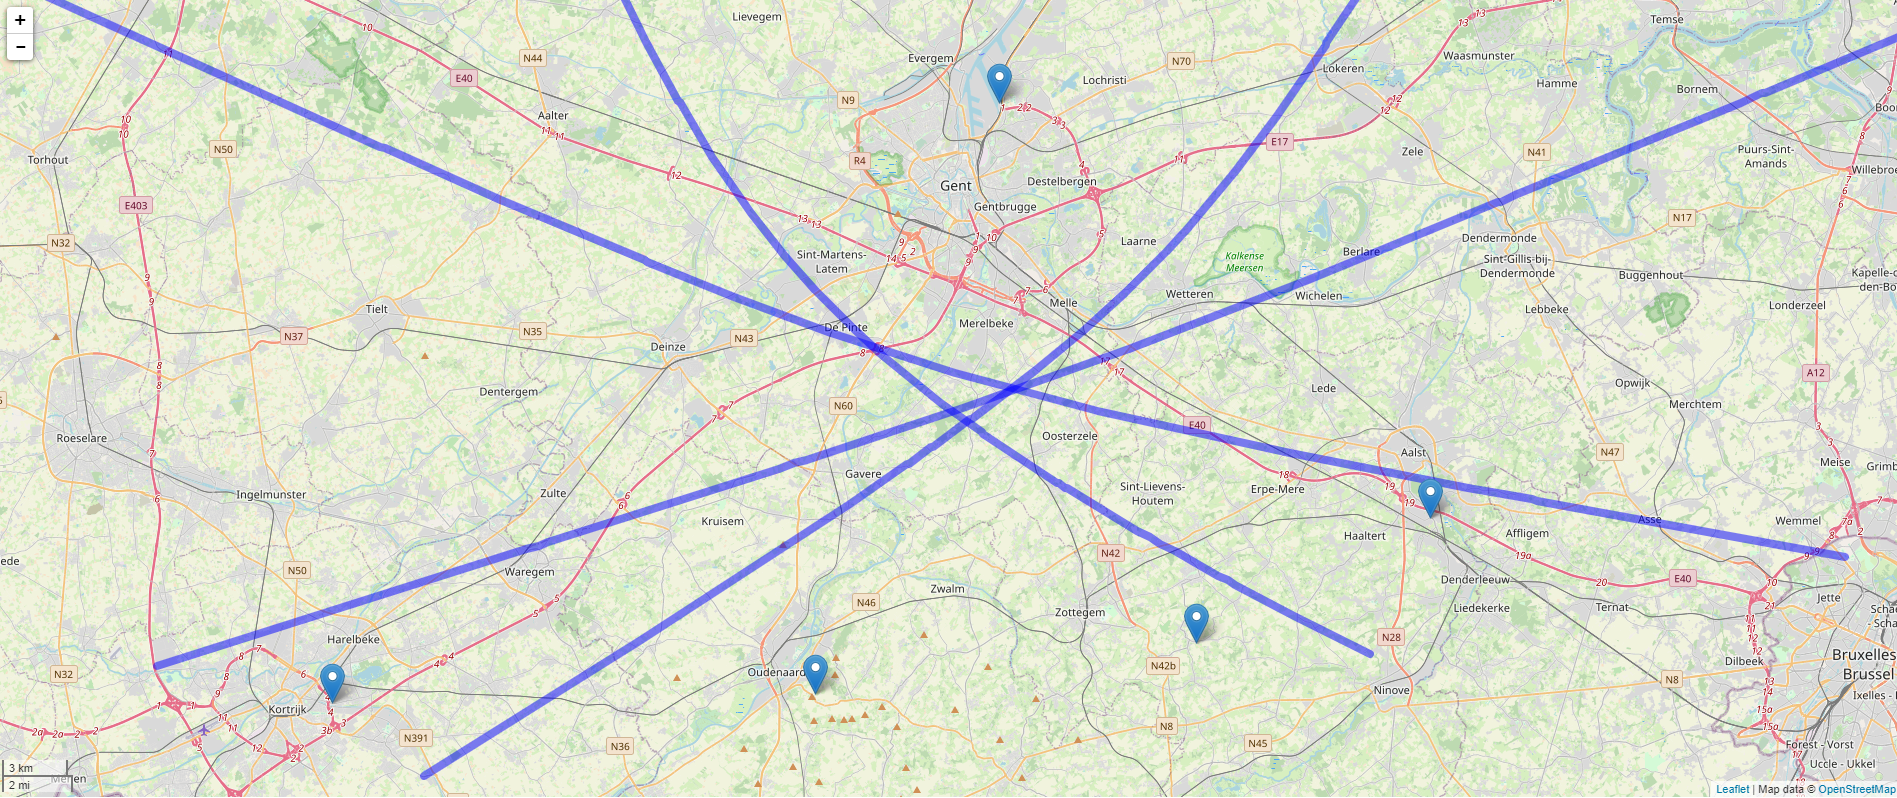
The observed postion is off by 5 kilometer, relative to the ‘ideal’ lag (peak).
In the map below, a detail of these intersecting TDOA-hyperboles:
Digital Radio as a weather station
The cited paper ‘The use of Signals of Opportunity for the Measurement of Atmospheric Refractivity’ (R. J. Watson*, C. J. Coleman) speaks of the influence of the weather of the DAB signals.
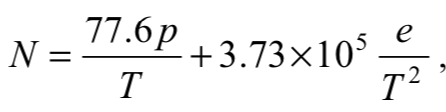
Raindrops absorb and scatter radio signals, creating a ‘wet lag’ . The amplitude and variation in lag is related to humidity and temperature using the formula below; p is atmospheric pressure (hPa), T is temperature (K) and e is the partial pressure of water vapour (hPa):
You could monitor temperature and rain, by monitoring the strength and variation in the ’lag’ as a ‘passive weather radar’. Passive weather radar normally use higher frequencies in the gigahertz region (because, 2.45 Ghz is an absorption line for water).
But, in theory, the weather in the surrounding region can be mapped out:
A weather station using DAB in practice
On the morning of the 21th January 2021, the humidity map was downloaded from the royal observatory of the region. It was cloudy all day, dry but raining after 16u30. The winter day was cold.
The difference in lags is shown below : Notice is the rise and decline of temperature on the noon.
- Lag 117 is Kortrijk 35 kilometer in the South: Most variation during the day with increase in delay at noon.
- Lag 52 is Aalst located 21 kilometer West. More variation later on the day, when there is more humidity.
This website is based on the following sources:
1. The paper ‘The use of Signals of Opportunity for the
Measurement of Atmospheric Refractivity R. J. Watson*, C. J. Coleman’ - (download)
2. The website ‘PanoradioSDR’ - Matlab scripts that do multilateral localisation of radio receivers.
3. Python scripts for channel-impulse-response of DAB signals. Nice tool, but, after two weeks of testing I didn’t understand what the tool was supposed to do.