Phase Noise
Analyzer - Sampling Frequency vs Spurs (Part2)
From
the classic sampling theory (or digital signal processing), the spurs are
theatrically existed. Analysis will be presented here. Matlab
scripts
have been written to complete some simple simulations. It is not a rigorous
script, but match the test results well. Examples are presented firstly. Test
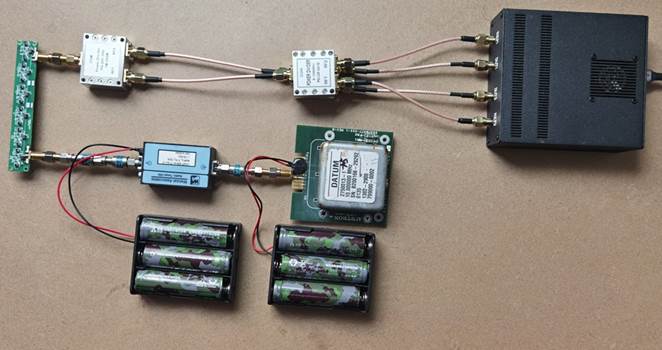
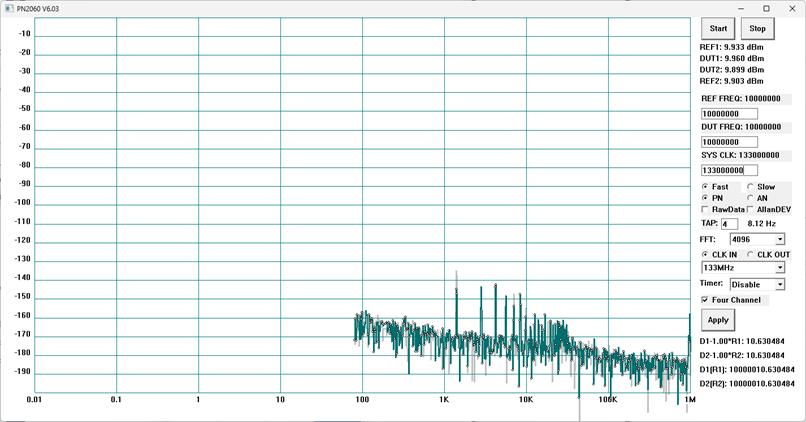
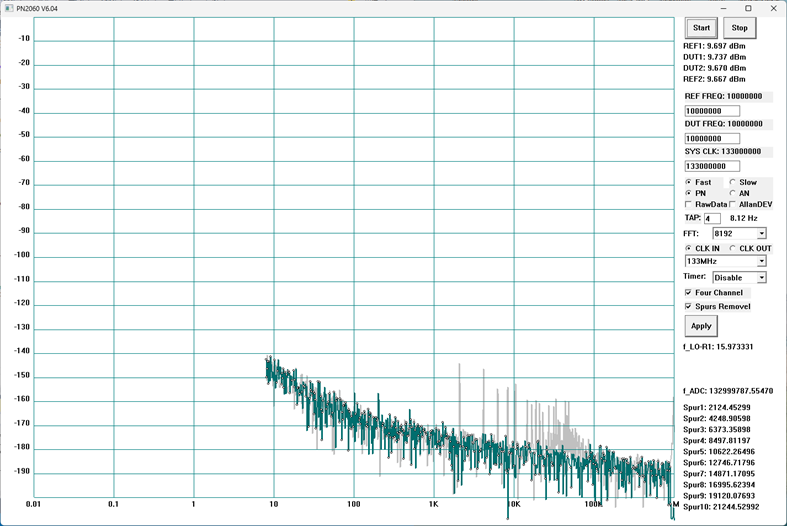
setup: all 4 ports are fed with a same 10MHz signal (for self-correlation). Let
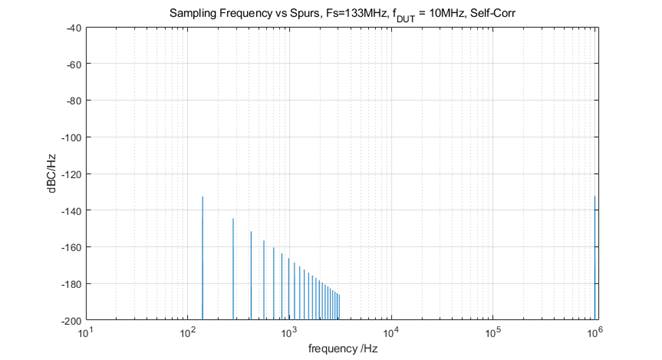
Fs=133MHz and f_DUT=10MHz, the following figure shows
the test result along with the simulation result.
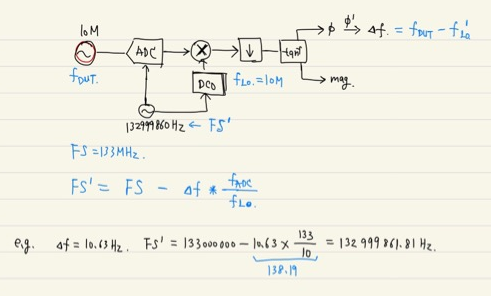
With FS=133MHz, the frequency
difference is 10.63Hz. It is shown with an option (Four Channel) on the UI,
where all the phase (frequency) data of the 4 channels will be uploaded to the
PC simultaneously.
With this value, the sampling
frequency of the ADC can be precisely calculated as shown in the following,
which is 132999861Hz. It can be verified if the SYSCLK is changed to this
value.
The
spurs can be simulated precisely with this value, and it can be tracked in
real-time also. An algorithm of “Spur Removel” is
added along with a CheckBox on the UI. It can work in
some scenarios, but far from perfect (not a trivial task really). Currently, it
is only for experiments (bugs also possible).
END