Solar Eclipse 2017
LF Radio Propagation Experiment
Conducted by John Magliacane, KD2BD, on August 21, 2017
Introduction
The solar eclipse that swept across the continental United States
on August 21, 2017 provided a unique opportunity to study the effects
the eclipse might have on radio signals propagating via the Earth's
ionosphere.
The lowest region of the ionosphere is the 'D' region. The 'D' region
is most rapidly affected by changes in solar radiation, and it is the
region responsible for long-distance radio communications in the
low-frequency (LF) radio spectrum.
The National Institute of Standards and Technology (NIST) operates
radio
station WWVB on a frequency of 60 kHz to within one part in
1014 from a transmitter located in Wellington, Colorado,
just north of Fort Collins. Since the path of totality was predicted
to cross the Great Circle path between WWVB and my home in East Central
New Jersey, hardware was developed over the summer months to try to
measure and record amplitude and phase perturbations that might occur
to reception of WWVB over the course of the eclipse.
Hardware Development
I employ a WWVB-disciplined frequency standard
of my own design as a reference for conducting
precision frequency measurements.
The ability to measure perturbations in the received phase of WWVB's
carrier would require the use of an independent frequency standard
having even greater precision and stability that would be immune to
the effects of the eclipse. In order to keep the uncertainty of the
WWVB carrier phase measurements to one degree or less over an eight
hour period, a frequency standard having an accuracy and stability to
within 1.6 parts in 1012 would be required. A clock having
this level of accuracy would be in error by less than one second in
50,700 years.
Realizing that some commercial AM radio broadcasters in the United
States employ GPS-disciplined Rubidium frequency standards to control
the frequency of their transmitters, a survey of every local AM radio
station within ground wave range was conducted using my WWVB-based
frequency measurement hardware. Through this process, radio station
WFAN in New York, NY was found to be broadcasting on exactly
660 kHz with no discernible signal fading after sunset.
A carrier phase tracking receiver was developed to generate a very
precise frequency reference from WFAN's 660 kHz carrier. This
reference was used to phase lock the local oscillator of a quadrature
phasing (image rejecting) direct conversion receiver of my own design
to exactly 236 kHz, thereby allowing reception of WWVB as a
1 kHz audio tone having all the amplitude and phase characteristics
of WWVB, itself.
The WFAN-derived Master Frequency Reference was also used to synthesize
a 60 kHz carrier. The 60 kHz carrier was downconverted to a 1 kHz audio
tone using exactly the same local oscillator and mixing processes
as those operating in the WWVB receiver.
Since each mixer was driven by the same 236 kHz local oscillator, any
phase instability present in the local oscillator would simply cause
the phase of the 1 kHz reference tone and that of the audio from the
WWVB receiver to track each other by exactly equal amounts. As
such, any phase deviations observed between these two audio sources
over time would be the result of changes in WWVB signal propagation at
60 kHz alone, rather than any vagaries of the hardware used to make the
measurements.
Audio from the WWVB receiver and the 1 kHz audio reference tone
were recorded concurrently for later processing and analysis using
a homebuilt Slackware v14.2 Linux-based PC running digital audio
recording software of my own design. Audio recorded during the
experiment is available through the HamSCI Community at
Zenodo.
 Overview of the Eclipse Propagation
Experiment Methodology employed by KD2BD
Overview of the Eclipse Propagation
Experiment Methodology employed by KD2BD
Some Results
Using the hardware described, peak carrier amplitude and carrier phase
measurements of WWVB were conducted between 14:00 UTC and 22:00 UTC on
the day of the eclipse. This eight hour period provided a substantial
amount of baseline data on both sides of the eclipse. Additional
baseline data was gathered for several days prior to the eclipse
as well.
Anomalous propagation effects were observed beginning at 17:00:00 UTC
when the phase of WWVB's carrier began to reverse its earlier upward
trend. The rising trend was probably the result of steadily rising
'D' region ionization levels throughout the day. Observations taken
on days prior to the eclipse showed the same effect, with a trend
in the opposite direction occurring after sunset (see
The Effects of Sunset below).
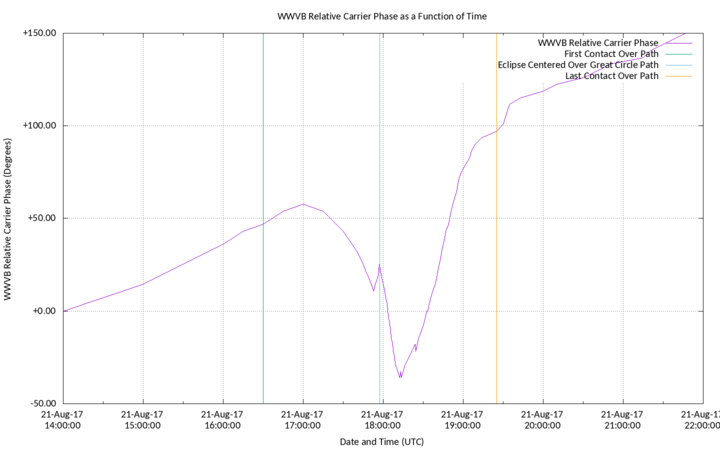 WWVB Relative Carrier Phase as a Function of Time on the Day of the Eclipse
At 17:57:20 UTC, the Moon's shadow crossed the 1622 mile Great Circle
path between WWVB and KD2BD along the east coast of Central New Jersey.
At that time, the center of the Moon's shadow was located over
south-central Nebraska at approximately 41.2 degrees North and 99.55
degrees West. While unrelated to the eclipse, the Sun produced an
X-ray burst at this time that affected the regions of the ionosphere
unprotected by the eclipse, and produced a "spike" in the
phase plot.
 The Path of Totality Crossed the RF Path Between WWVB and KD2BD at 17:57:20 UTC
Maximum carrier phase shift and maximum signal strength rise were
both observed at 18:13:00 UTC when the Moon's shadow was located over
North Central Missouri at approximately 38.966 degrees North and
92.666 degrees West.
It is interesting to note is that an abrupt change in carrier phase
occurred well before the path of totality crossed the Great Circle
path between WWVB and New Jersey. However, WWVB's carrier amplitude
remained remarkably constant until the path was nearly fully eclipsed.
 WWVB Relative Carrier Amplitude as a Function
of Time on the Day of the Eclipse
WWVB Relative Carrier Amplitude as a Function
of Time on the Day of the Eclipse
Some Projections and Hypotheses
-
The phase of WWVB advanced at
a rate of approximately 19 degrees per hour prior to the onset of
the eclipse. This corresponds to a continuous decrease in RF path
length of approximately 263.7 meters per hour, or a total of 799.4
meters between the start of data collection at 14:00 UTC, and the
time the rising phase began to reverse its upward trend shortly after
17:00 UTC when a maximum phase shift of +57.6 degrees was measured.
-
The phase plot shows effects of the eclipse
continued until approximately 19:30 UTC, for a duration of 2 hours
and 30 minutes.
- After the eclipse, the phase resumed its
rising trend, but this time at a slightly lower rate of approximately
16.5 degrees per hour.
- Ignoring the period of the eclipse, the
average rate of carrier phase advancement was approximately 17.75
degrees per hour over the eight hour period studied.
- If this average rate is applied throughout
the eclipse period, we can project an estimated carrier phase of +80
degrees at 18:13 UTC had the effects of the eclipse not been present.
- The measured carrier phase at this time
was -36.0 degrees, which is 116 degrees behind the projected value.
At a carrier frequency of 60 kHz, this phase retardation corresponds
to a free-space RF path length increase of 1.609 km, or very close
to 1 statute mile.
- The phase of WWVB was clearly affected to a
much greater extent than its amplitude during the eclipse. One might
expect similar effects to both aspects of the signal had WWVB been
received through similar amounts of surface wave and ionospheric wave
propagation. Since this was not the case, the RF path between WWVB and
KD2BD was likely one where the skywave path was significantly dominant.
This premise is consistent with previously published NBS literature that
suggests propagation at 60 kHz across a 1622 mile distance to be the
result of a two-hop path.
- As such, the 4 dB signal strength increase
observed during the eclipse may have been due to increased 'D'
region efficiency, rather than the vector addition of skywave
and surface wave paths moving toward a closer phase alignment at
the receiving location during the time of the eclipse.
- The narrow signal peak within the center of
the broader peak might be a multipath and/or focusing effect due to
'D' region scattering. It does not appear to be due to solar weather
events because there were none occurring at that time. The
"spike" on the leading edge, however, may have been
due to a solar X-ray burst occurring at that time.
The Effects of Solar Weather Events
Fortunately, the Sun was relatively
quiet during the eclipse, although there were several minor events that
slightly affected the results illustrated here. In particular, Solar Event
#3370 occurred just as the RF path was entering into full eclipse, and is
believed to be responsible for "spike" in the phase plot at
17:57 UTC:
:Product: 20170821events.txt
:Created: 2017 Aug 24 0357 UT
:Date: 2017 08 21
# Prepared by the U.S. Dept. of Commerce, NOAA, Space Weather Prediction Center
# Please send comments and suggestions to [email protected]
#
# Missing data: ////
# Updated every 5 minutes.
#                            Edited Events for 2017 Aug 21
#
#Event    Begin    Max       End  Obs  Q  Type  Loc/Frq   Particulars       Reg#
#-------------------------------------------------------------------------------

3370 +     1739   1757      1801  G13  5   XRA  1-8A      C3.0    1.8E-03
3370 +     1754   1754      1754  SAG  G   RBR  410       110

3380       1958   1958      1958  PAL  G   RBR  245       100

3390 +     2012   2022      2026  G13  5   XRA  1-8A      C1.5    6.2E-04   2671
3390       2019   2021      2029  HOL  3   FLA  N09W23    SF      DSD       2671
3390 +     2019   2021      2021  PAL  G   RBR  1415      45                2671
3390 +     2019   2021      2021  PAL  G   RBR  4995      30                2671
3390 +     2021   2021      2021  PAL  G   RBR  410       30                2671
3390 +     2021   2021      2021  PAL  G   RBR  8800      20                2671
3390 +     2021   2021      2021  PAL  G   RBR  610       130               2671
3390 +     2021   2021      2021  PAL  G   RBR  2695      12                2671
|
Some of the Larger Solar Events that Occurred Within the Data Gathering Period on the day of the Eclipse
It is possible that Solar Event #3390 may have
caused the small "spike" in signal amplitude recorded around
20:20 UTC, however, no observable change in carrier phase was detected
at that time.
 GOES X-Ray Flux Levels from August 19 through
August 21, 2017
GOES X-Ray Flux Levels from August 19 through
August 21, 2017
Solar Flares and X-Rays
More significant X-ray events
occurred on the days leading up to the eclipse, and many of these
produced measurable increases in WWVB signal levels. However, unlike
the signal enhancement caused by the eclipse, the 3.3 dB signal level
increase caused by solar event #3190 on August 20, 2017 (for example)
had a significantly shorter rise time compared to its fall time:

WWVB Relative Carrier Amplitude Recorded on August 20, 2017
While the X-ray burst affected a much larger area
of the ionosphere, it had a relatively minor effect on received carrier
phase compared to the solar eclipse that affected a much smaller
region of the ionosphere:
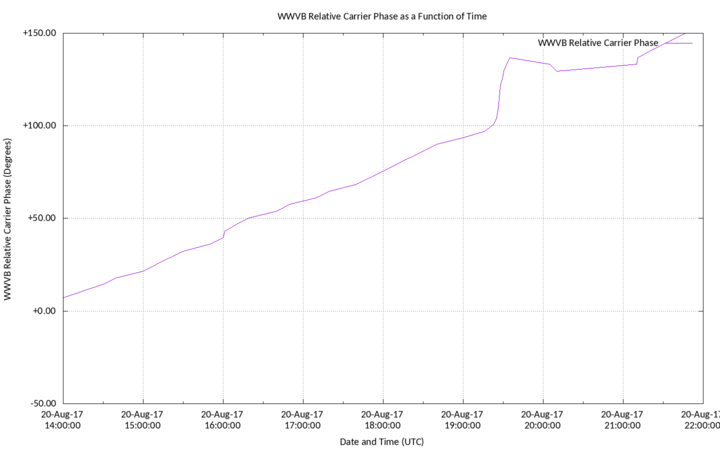
WWVB Relative Carrier Phase Recorded on August 20, 2017
:Product: 20170820events.txt
:Created: 2017 Aug 23 0357 UT
:Date: 2017 08 20
# Prepared by the U.S. Dept. of Commerce, NOAA, Space Weather Prediction Center
# Please send comments and suggestions to [email protected]
#
# Missing data: ////
# Updated every 5 minutes.
#                            Edited Events for 2017 Aug 20
#
#Event    Begin    Max       End  Obs  Q  Type  Loc/Frq   Particulars       Reg#
#-------------------------------------------------------------------------------

3190 +     1920   1939      1949  G13  5   XRA  1-8A      C9.4    1.1E-02   2672
3190       1935   1935      1939  SAG  G   RBR  610       21
3190       1935   1938      1940  SAG  G   RBR  4995      36
3190       1935   1938      1940  SAG  G   RBR  8800      110
3190       1935   1938      1940  SAG  G   RBR  15400     95
3190       1935   1939      1939  SAG  G   RBR  2695      26
3190       1937   1938      1939  SAG  G   RBR  1415      35
3190       1938   1938      1939  SAG  G   RBR  410       76
3190       1938   1938      1938  SAG  G   RBR  245       30
|
Some details of Solar Event #3190 that produced a large increase
in WWVB signal level at 19:40:00 UTC on August 20, 2017.
A full understanding and appreciation of the
effects the solar eclipse had on the Earth's 'D' region requires a
consideration and elimination of any solar weather events that may
have been occurring at the time. While the ionosphere directly below
the eclipse may have been shielded very briefly from such events, the
same cannot be said for the remaining sunlit portions of the ionosphere
that were also responsible for signal propagation.
The Effects
of Sunset
As a further "sanity
check", the phase and amplitude of WWVB were examined during
sunset periods in early October to further test the hardware used
during the eclipse and to further validate the results obtained during
the experiment.

WWVB Relative Carrier Phase Recorded During Sunset on October 1, 2017
In this plot, the carrier phase can be
seen continuing its normal daytime rise until about an hour and
a half after local sunset (22:31:09 UTC as determined through
PREDICT Software) when the rise began
to reverse its earlier trend.
The phase plunged over 145 degrees between
23:30:00 UTC on October 1, 2017 and 00:10:00 UTC on October 2, 2017,
implicating an RF path length gain of over 2 kilometers during that
40 minute period. Overall, the sunset period contributed to an
increase in RF path length of nearly 3 kilometers, which implies that
that WWVB signal propagation remained within the 'D' region of the
ionosphere, and did not rise to any higher regions after sunset.

WWVB Relative Carrier Amplitude Recorded During Sunset on October 1, 2017
The carrier amplitude increased by a little over
10 dB during the sunset period, but not before undergoing several
undulations in signal strength before the radio path was completely
immersed in darkness. While in darkness, short-term signal strength
variabilities increased noticeably, and the phase plot shows some
short-term variabilities during this time period as well. Since WWVB
was significantly stronger at this time, noise is not a likely cause of
this variability.
References and Further Information
This page was last modified
on May 10, 2024.


