 |
 |
 |
|
|
|
The National Institute of Standards and Technology (NIST) operates
radio
station WWVB on a frequency of 60 kHz accurate to within one part
in 1014 from a transmitter located in Wellington, Colorado,
just north of Fort Collins. The path of totality was predicted to
cross the Great Circle path between WWVB and my home in East Central
New Jersey, and hardware similar to that developed prior to the 2017
total solar eclipse was employed to measure and record amplitude and
phase perturbations that might occur to reception of WWVB over the
course of the eclipse.
Reception of WWVB on April 8, 2024 was impaired slightly due to
the fact that WWVB's south antenna suffered damage from wind gusts
in excess of 90 MPH and was disabled from approximately 00:00 UTC
on April 7, 2024, leaving the station operating at reduced power
(30 kW ERP vs. 70 kW) using its north antenna only.
 |
 |

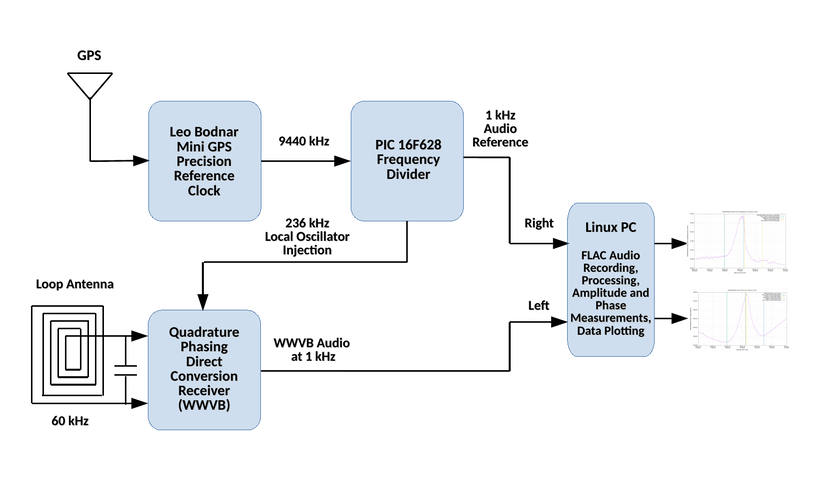
WWVB audio from the receiver at 1 kHz along with the GPS-derived 1 kHz
audio reference tone were recorded as a stereo FLAC audio file using a
Slackware v14.2 Linux-based PC running the "rec" script that is part
of the Sound eXchange
(SoX) audio editing software application. This recording is
available for further research and analysis through Zenodo.
The recording was processed using software recently developed by KD2BD
for analyzing the 2024 eclipse. Written in 'C' under Slackware Linux,
the software reads the 3.8 GB stereo audio recording, measures and records
peak waveform amplitude and phase relative to the GPS-derived 1 kHz
reference tone recorded during the eclipse, and generates output
files that are passed to gnuplot
for graph generation.
The signal-to-noise ratio of WWVB wasn't very high due to local noise
sources and WWVB's damaged antenna system. While the receiver has a
3-dB bandwidth of only 50 Hz, further bandwidth reduction on the order
of 0.01 Hz was performed by my signal analysis software to remove as
much of the remaining noise possible while leaving the slow moving
effects of the eclipse clearly evident in the plotted results. Both
the signal amplitude and phase measurements made through my software
were validated through a separate sequence of measurements taken with
an audio playback of the recording viewed on Tektronix 465 oscilloscope.
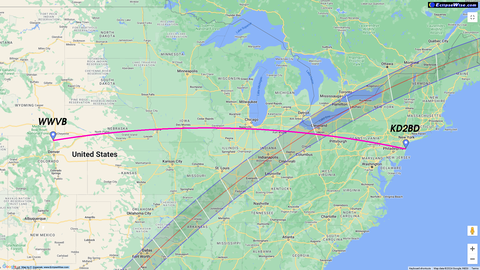
The Great Circle path between WWVB and KD2BD is 1622.47 miles (2611.11 km)
long and is on an azimuth bearing of 81.09° from WWVB and 281.47°
from KD2BD. The path of totality and the Great Circle RF path met
over Norwich Township, Ohio (41.122° N, 82.74° W) (just a
little south of Havana) at 19:14 UTC. The mid-point of the RF path
falls over Dover Township, Illinois (41.457° N, 89.491° W).

| First Contact | 17:30 UTC |
| Maximum Obscuration (62.7%) | 18:41 UTC |
| Last Contact | 19:54 UTC |
| First Contact | 17:57 UTC |
| Totality Begins | 19:12 UTC |
| Totality Midpoint | 19:14 UTC |
| Totality Ends | 19:16 UTC |
| Last Contact | 20:28 UTC |
| First Contact | 18:10 UTC |
| Maximum Obscuration (88%) | 19:25 UTC |
| Last Contact | 20:36 UTC |
Data collection began at 16:00 UTC when the center of the Moon's shadow
was over the North Pacific Ocean between Hawaii and Peru (4.06°
N, 126.03° W). Data collection extended for four hours placing
the eclipse passage over the RF Great Circle Path close to the center
of the collection period.
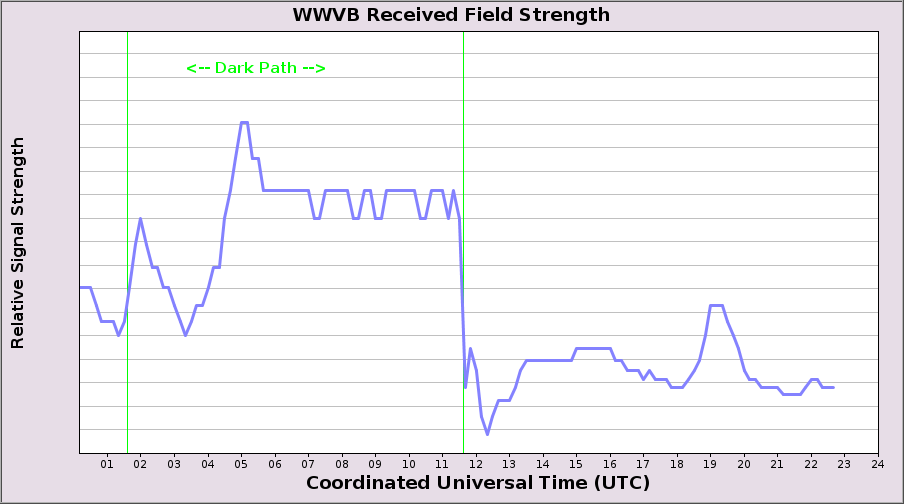
The amplitude of WWVB began rising shortly after obscuration began
over Norwich Township, Ohio. It reached a peak a few minutes prior
to totality, rising about 6.2dB above the baseline amplitude level
seen prior to the Moon's shadow impacting WWVB or any other part of
the RF path earlier in the day. It is interesting to note that WWVB's
signal level peaked several minutes prior to totality occurring
over the RF path during the 2024 eclipse, while it peaked several
minutes after totality during the 2017 eclipse.
The rise to the top features a small "dent" or "shelf" where the
increasing amplitude stalled briefly before resuming its rise to
the top. At the peak, small "ripples" can be seen. Similar
features were observed during the 2017 eclipse as well.

The Sun is the major ionizing source for the 'D' region. During an
eclipse, the Moon's shadow cools the atmosphere and causes a decrease
in the electron, or plasma, density in the ionosphere. This decrease
in ionization modifies either the effective speed of propagation and/or
the effective path length the radio signal from WWVB must travel to
reach my receiver in New Jersey. The relative carrier phase plotted
here is directly proportional to the effective RF propagation path
length and the change in the Time Delay of Arrival (TDOA) of the
60 kHz RF carrier.

This W-shaped curve is remarkable in that it illustrates a
decreasing RF carrier phase trajectory that began two hours in advance
of first contact occurring over the path intersection when the center
of the Moon's shadow was some 3703 miles (5960 km) away. It is
speculated that this could be the signature of a foreshock wave
traveling through the ionosphere well in advance of the Moon's
shadow. This phenomenon was not seen during the 2017 eclipse.
A maximum carrier phase shift of about 106°, or an extension of
about 1472 meters in effective RF path length, occurred just as
totality over the path intersection ended, which is an amount similar
to what was observed in 2017.
This peak was followed by a rising phase trajectory after last contact
occurred, appearing nearly as a mirror image of what occured prior to
the eclipse. This upward trajectory may illustrate evidence of an ionospheric
bow wave trailing behind the eclipse. Nature always seeks an
equilibrium.
NIST maintains a network of three WWVB time code monitoring sites around the United States,
two of which recorded signal level enhancements between 19:00 UTC
and 20:00 UTC on April 8, 2024. Although the y-axes carry no labels,
these plots indicate measured field strength in microvolts per meter,
with measurements recorded once every 10 minutes.
The RF path to the Gaithersburg, Maryland receiver encountered
a total eclipse, while the path to the LaCrosse, Wisconsin receiver
was subject to only a partial eclipse. This difference is evident by
the sharp signal peak seen in the Maryland plot while the Wisconsin
receiver recorded a plateau. In neither case did signal levels during
the eclipse reach the levels seen during nighttime hours.

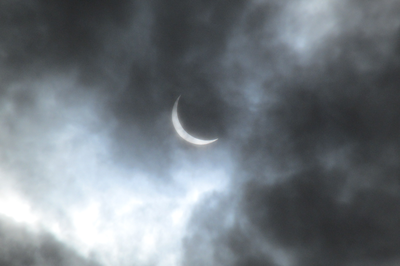
The solar eclipse peaked at KD2BD with a maximum obscuration of 88%
at 19:25 UTC (15:25 EDT). Low-level clouds began gathering just prior
to this time. Local air temperatures fell several degrees and wind
gusts increased as the eclipse progressed.


This page was last modified on May 19, 2024.

|
John Magliacane,
KD2BD © 2024 kd2bd <AT> qsl <DOT> net |