Frequency Deviation Measurement with an RTL-SDR Dongle
A PC Computer and RTL-SDR Dongle as a Signal Spectrum Analyzer
by Dr. Carol F. Milazzo, KP4MD (posted 15 April 2018)E-mail: [email protected]
This article describes in detail how to setup an RTL-SDR dongle or other low cost software defined radio together with free and low cost software to measure the frequency deviation of an FM transmitter using the Bessel Zero method.
The video demonstration is posted at https://www.youtube.com/watch?v=lWcFqsh7ZvQ
A captioned photo album is posted at https://photos.app.goo.gl/vEwws87jF4ZDWGIU2
The slideshow is posted at https://docs.google.com/presentation/d/1TgVAV_bu_KcGH1FqpsLLwZ4KMmqZQfXpf_zMQtK_3p0/edit?usp=sharing
Hardware Requirements
- A PC computer running Microsoft Windows OS,
- an RTL-SDR dongle, SDRplay or other software defined radio compatible with the SDRSharp program,
- and a sine wave audio source of known frequency and
adjustable amplitude (1200 Hz in the example).
Visual Analyser's software sine wave generator may suffice with adequate attenuation and isolation between the computer line output and the transmitter.
Software Requirements
- SDRSharp - Free download. Setup with instructions on https://www.rtl-sdr.com/rtl-sdr-quick-start-guide/
- Visual Analyser. Free MS Windows oscilloscope software download from http://www.sillanumsoft.org/prod01.htm
- Virtual Audio Cable. This application pipes the demodulated audio stream from SDRSharp directly to the Visual Analyser program through software. Download and purchase from https://vac.muzychenko.net/en/
SDRSharp Setup
- First, install Virtual Audio Cable
- Install SDRSharp (described in detail on https://www.rtl-sdr.com/rtl-sdr-quick-start-guide/)
- Plug the RTL-SDR dongle into a USB port on the computer.
- Use Zadig.exe to install the WinUSB driver
- Run SDRSharp.
- Under the Source tab select "RTL-SDR/USB" in the drop down box.
- Click the Gear icon on the top menu to open the Configure pop-up window.
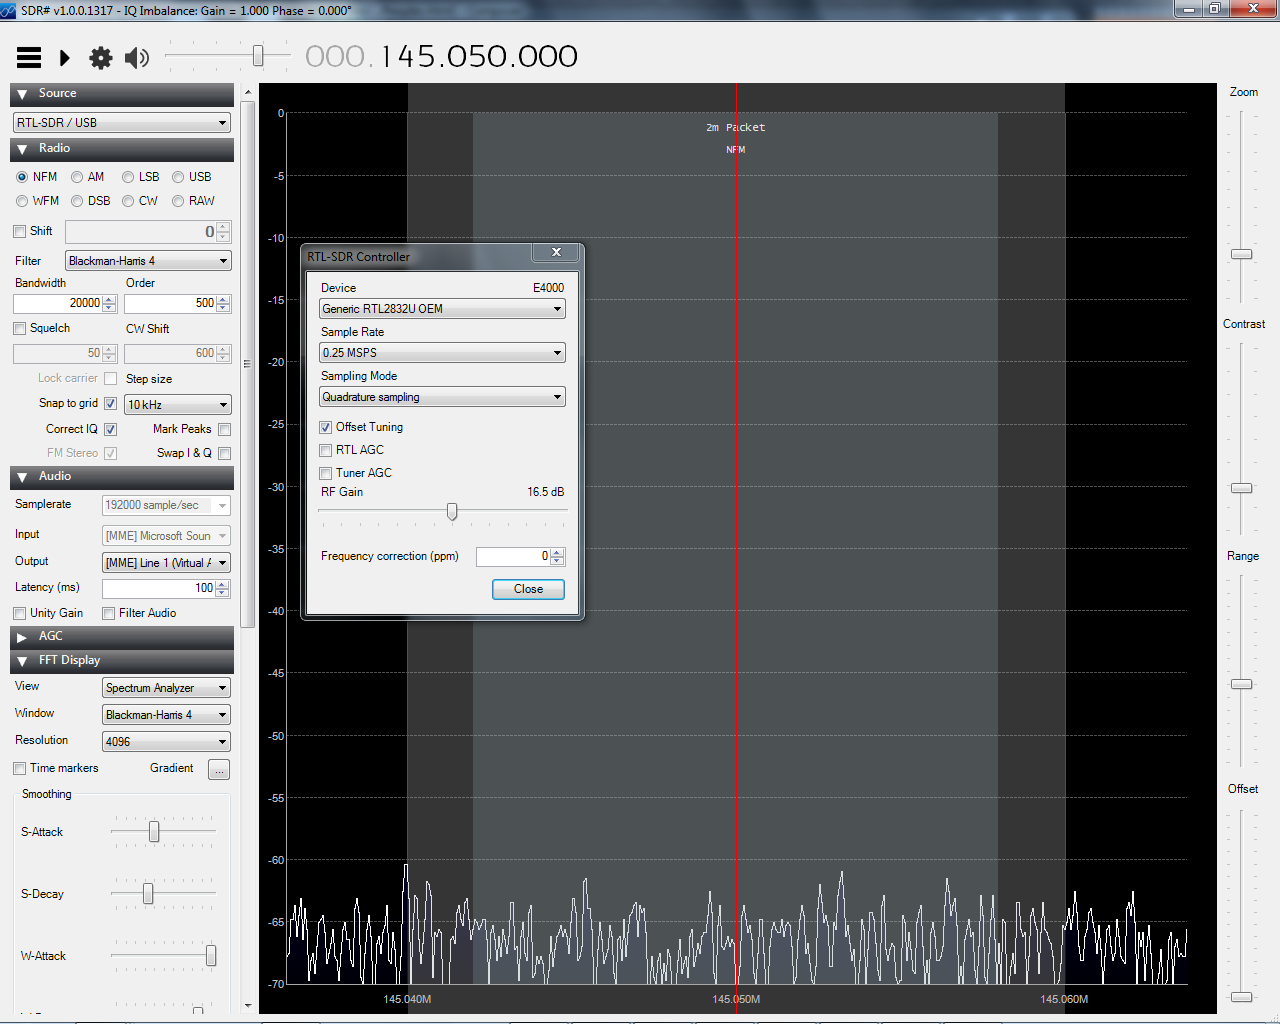
- Select the RTL Device and choose Sample Rate 0.25 MSPS for greatest detail, uncheck both AGC boxes, then click "Close"
- Set SDRSharp to the same frequency as the transmitter by clicking on the top or bottom of each digit on the frequency display on the top menu.
- Under the Radio Tab click Radio button "NFM", type "20000" in bandwidth, Select Step size 10 kHz, uncheck the Squelch box.
- Under the Audio Tab select Line 1 (Virtual Audio Cable) in the Output drop down box and uncheck the Filter Audio box.
- Scroll down to FFT Display tab and select Spectrum Analyzer in the View drop down box, then click "OK".
- Scroll down to Zoom FFT tab and uncheck all the boxes.

Visual Analyser Setup
- Install Visual Analyser
- Run Visual Analyser
- Check the "Values" box to the right of the top scope display.
- Click the Settings Button on the top menu to open the Settings pop-up window
- Select the Device tab, and Select Line 1 (Virtual Audio Cable) in the Input device drop down box.
- In the video I had also activated the "Freq Meter" button to display the modulating tone frequency.

Set the RF Gain on SDRSharp
The SDR receiver can be damaged by applying excess RF power to its antenna connector. Use the lowest transmitter power possible during testing. The RTL-SDR may pick up sufficient off the air signal directly though its plastic case or with a short pickup wire in its antenna connector. Alternatively, you may couple signal from the transmitter to the RTL-SDR through an appropriate dummy load and attenuator.- Click the right arrow icon to start SDRSharp.
- Slide the Zoom slider to widen the shaded area to fill most of the display window. You should display about 30 kHz.
- While the transmitter is off, adjust the "Range" slider to lower the trace so it remains visible at the bottom of the display.
- Key the transmitter with no modulation and observe the height of the peak in the center of the display.
- If the trace appears to shoot above the top of the display, stop SDRSharp, click the Gear icon on the top menu to open the Configure pop-up window, and slide the RF Gain slider a bit to the left, close the Configure pop-up window, start SDRSharp again and return to step 3.
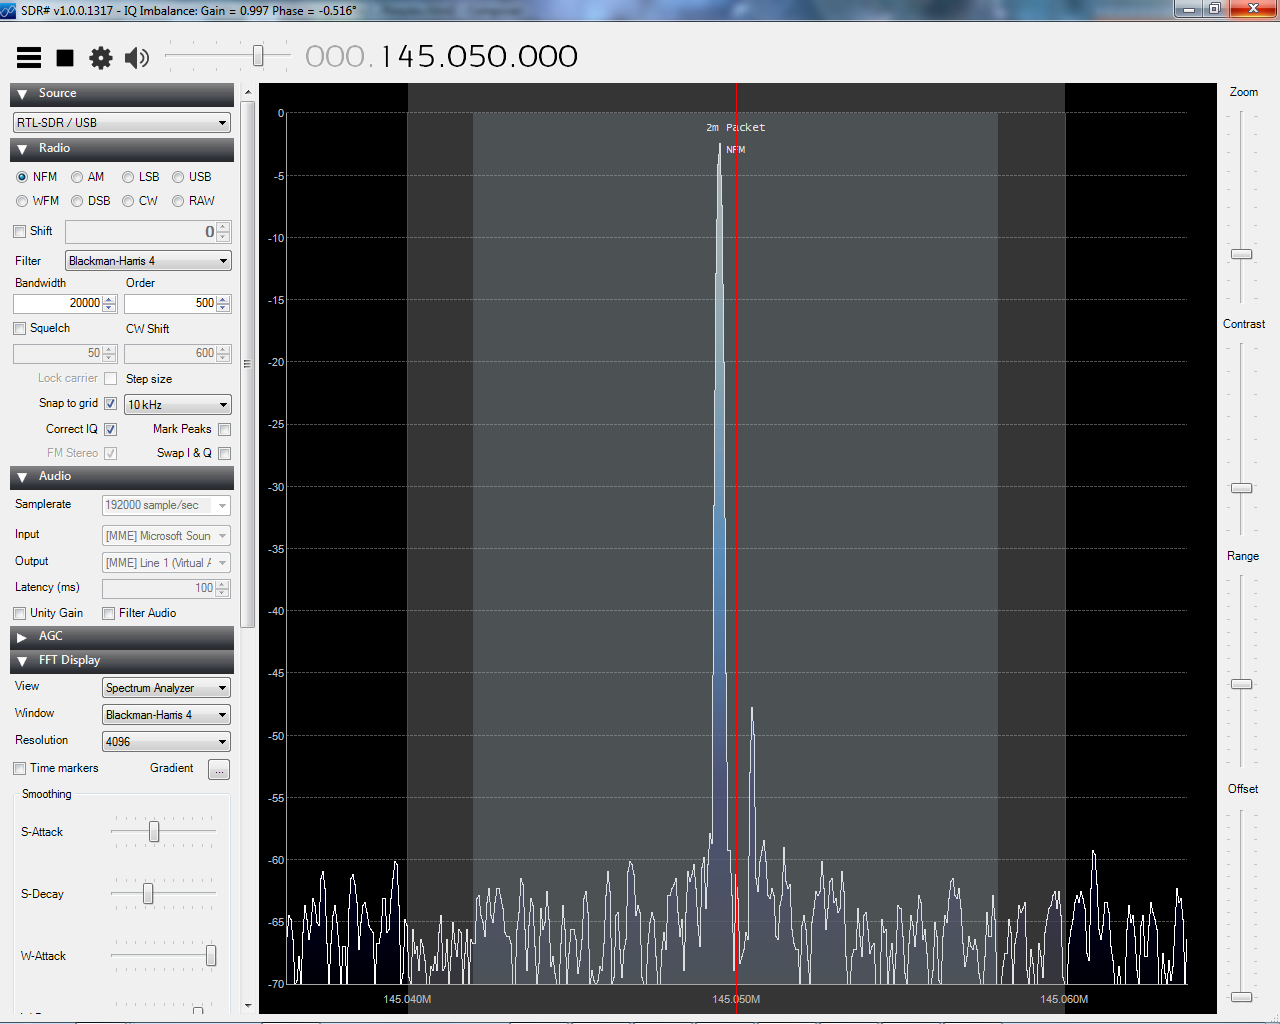
- Repeat these adjustments as necessary so that the trace fills most of the display like the picture on the right while transmitting without modulation.

Set the Audio Output Level on SDRSharp
- Click on the 3 horizontal bar icon in SDRSharp to hide the drop down settings.
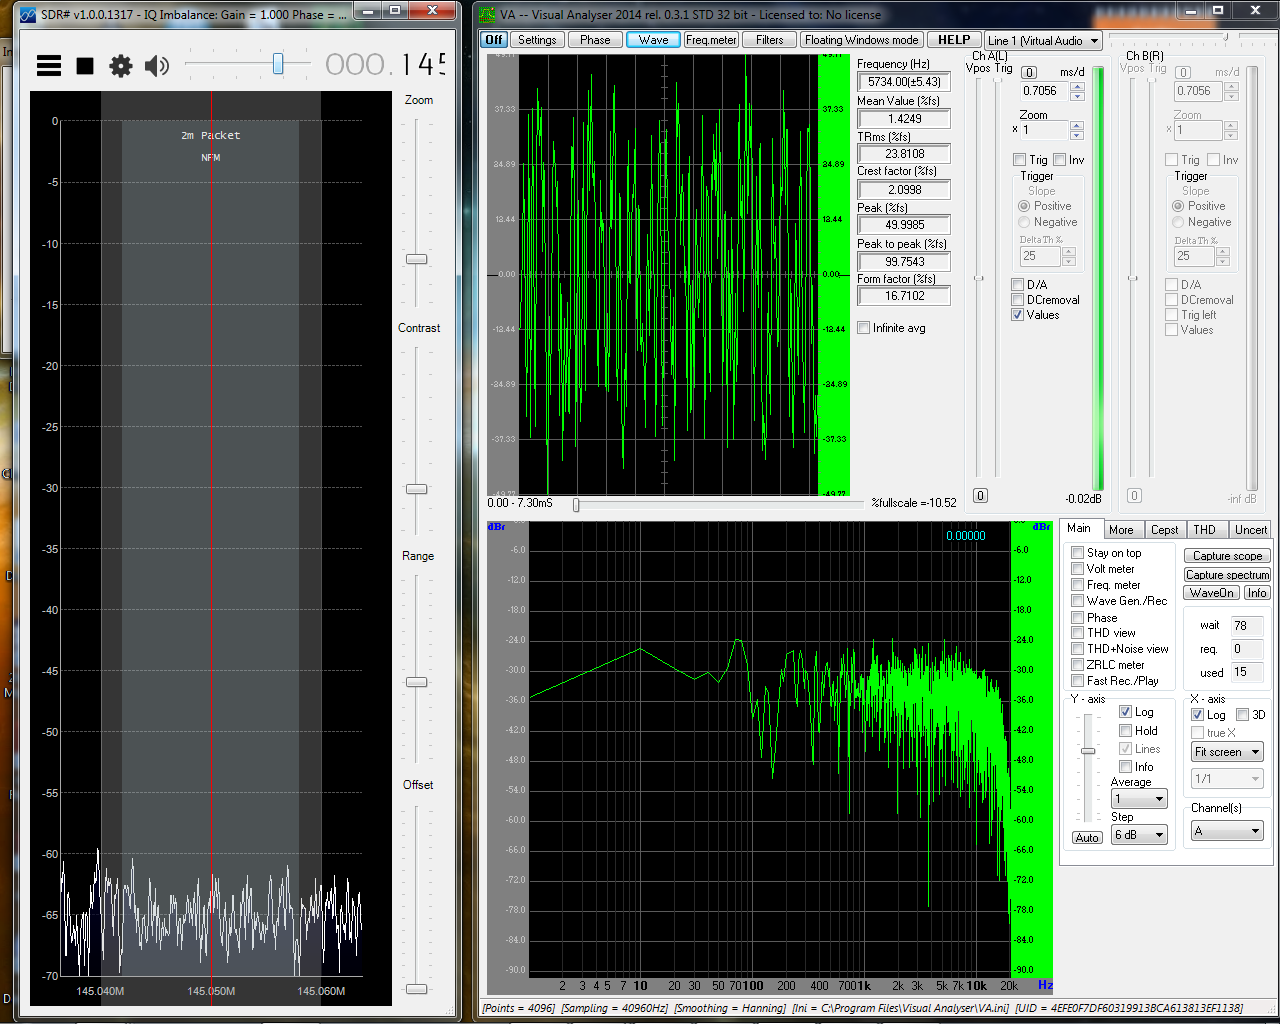
- Resize SDR and Visual Analyser windows to display them side by side.
- Start SDRSharp and click the "On" button in Visual Analyser.
- While the transmitter is off, adjust the Volume slider in SDRSharp (between the Speaker icon and the Frequency digits) towards the right. Once you reach the point where the random waveform in the upper scope window no longer increases in vertical size, stop and slide the Volume slider back about 3 dB.
- Transmit an unmodulated signal (CTCSS also off) on the receiver frequency and the oscilloscope trace waveform should display a flat horizontal line that is vertically centered on the zero reference line. If the unmodulated carrier wave trace on the scope is above or below the zero reference line, adjust the Frequency correction (ppm) setting in the SDRSharp Configure pop-up window to center it onto the zero line.
- If there is significant random noise on the scope trace of the unmodulated signal, adjust the RF gain slider in the SDRSharp Configure pop-up window for minimal noise and use the SDRSharp Range and Offset sliders to resize and fit the RF spectrum display in the window.
- By varying the transmitter 5 kHz on either side of the carrier frequency you may carefully adjust the SDRSharp audio output level, the Visual Analyzer Ch A(L) Zoom setting and the Settings > Scope > Scope > Scope grid > Y divisions so that each major vertical division corresponds to one kHz of frequency displacement. The peak frequency deviation of a modulated signal could then be directly estimated from a reading off the scope grid.
SDRSharp and Visual Analyser are now properly adjusted to begin the Bessel Zero calibration as demonstrated in the video. You may use the "Audio Repeater" program under the Virtual Audio Cable in the Windows Start Menu to monitor the demodulated audio through the computer speakers. Set the Wave In to Line 1 (Virtual Audio Cable) and the Wave Out to the speaker device and click the "Start" button to listen.

Calibrate the Frequency Deviation
To calibrate your frequency deviation measurements, feed a pure sine wave of known frequency to the audio input of the transmitter preferably through a dedicated data port jack, if available, to bypass the FM speech 6 dB/octave pre-emphasis circuits and to avoid overload distortion in the sensitive microphone preamplifier circuit.In the video, the amplitude of the 1200 Hz sine wave is slowly increased from zero until a null appears on the carrier frequency. This null, called a Bessel Zero, occurs at various predicted modulation indices (2.4, 5.52, 8.66, etc) where the Modulation Index is defined as the peak frequency deviation divided by the modulating frequency.
For a 1200 Hz sine wave modulating tone, the first Bessel Zero occurs at a frequency deviation of �2.88 kHz as 2.4 = 2.88 kHz/1.2 kHz. Likewise, a 1250 Hz modulating tone would display its Bessel Zero at �3 kHz frequency deviation, etc.
In the video, the oscilloscope indicates a Peak to peak (%fs) value of 54.3% at the first Bessel Zero, this amplitude then corresponds to �2.88 kHz deviation.
For this calibration, the peak-to-peak amplitude is observed to equal the frequency deviation multiplied by a constant factor of 18.9, that is, P-P%= FreqDev � (54.3�2.88) = FreqDev � 18.9. Using the constant factor, we can prepare this table that lists the peak to peak amplitude measurement for each corresponding frequency deviation.
Confirm the calibration by transmitting an unmodulated signal 5 kHz above, then 5 kHz below the center frequency. This should raise or lower the horizontal trace away from the zero reference by the same amount as predicted for �5 kHz frequency deviation.
| Frequency Deviation | P-P Amplitude |
|---|---|
| �1 kHz | 19% |
| �2 kHz | 38% |
| �3 kHz | 57% |
| �4 kHz | 75% |
| �5 kHz | 94% |