MiniVNA Calibration

Vector network analyzer calibration basics for transmission mode measurements

by Dr. Carol F. Milazzo, KP4MD (posted 23 Mar 2014)
E-mail: [email protected]

This basic technique accurately calibrates the vector network analyzer (VNA) to measure devices like filters and amplifiers in transmission mode.
The equipment required are the vector network analyzer with attached coaxial cables and a double female inline coupler. This technique permits the accurate measurement of device characteristics and compensates for the effects of the cable and connector properties on measurements.


Here is the equipment required to accurately
                      calibrate the vector network analyzer (VNA) to
                      measure a device (e.g., filter or amplifier) in
                      transmission mode: the VNA with attached coaxial
                      cables and a double female inline coupler. This
                      calibration technique permits the accurate
                      measurement of the device characteristics and
                      compensates for the effects of the cable and
                      connector properties on the measurement.

1. Here is the equipment required to accurately calibrate the vector network analyzer (VNA) to measure a device (e.g., filter or amplifier) in transmission mode: the VNA with attached coaxial cables and a double female inline coupler.  This calibration technique permits the accurate measurement of the device characteristics and compensates for the effects of the cable and connector properties on the measurement.

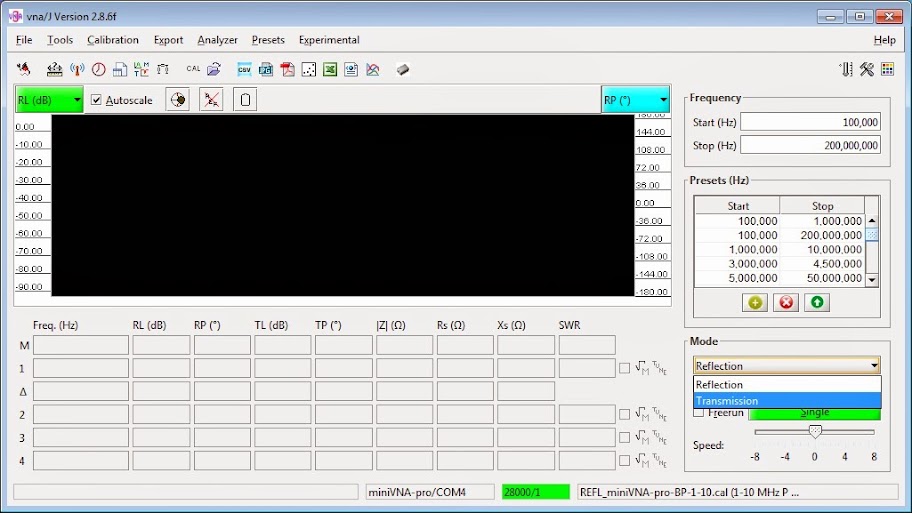
In vna/J select "Transmission" in
                      the Mode drop-down box.

2. The vna/J program1 that is supplied for the MiniVNA starts in the Reflection mode by default.  Select "Transmission" in the Mode drop-down box.

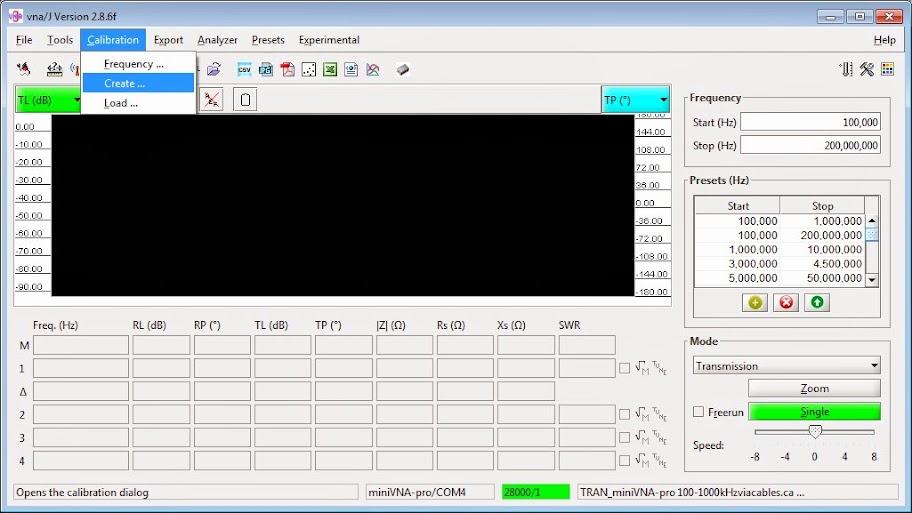
In the top menu bar select Calibration >
                      Create

3. In the top menu bar select Calibration > Create.

The default calibration is Mode 2 (0.1 - 200
                      MHz). For greater detail when measuring a specific
                      frequency range, select Mode 1 and click on the
                      desired frequency range in the scrolling list. In
                      this example, I selected 100,000 - 999,999 Hz to
                      measure a 5 pole low frequency low pass filter.2
                      The filter circuit design and details are found at
                      http://www.qsl.net/kp4md/lpfilter.htm

4. The default calibration is Mode 2 (0.1 - 200 MHz).  For greater detail when measuring a specific frequency range, select Mode 1 and click on the desired frequency range in the scrolling list.  In this example, I selected 100,000 - 999,999 Hz to measure a 5 pole low frequency low pass filter.2  The filter circuit design and details are found at http://www.qsl.net/kp4md/lpfilter.htm

With the coaxial cables connected to the DUT
                      and DET ports on the VNA and the free ends
                      unconnected, click on the "read OPEN"
                      button. After this step, the calibration window
                      will resemble this one.

5. With the coaxial cables connected to the DUT and DET ports on the VNA and the free ends unconnected, click on the "read OPEN" button.  After this step, the calibration window will resemble this one.

For the next step, connect the free ends of
                      the coaxial cables together through the double
                      female inline coupler. This will calibrate the VNA
                      exclusively for measurements between the free ends
                      of the coaxial cables.

6. For the next step, connect the free ends of the coaxial cables together through the double female inline coupler.  This will calibrate the VNA exclusively for measurements between the free ends of the coaxial cables.

With the free ends of the coaxial cables
                      connected through the double female inline
                      coupler, click on the "read LOOP"
                      button. After this step, the calibration window
                      will resemble this one. Click the "Save"
                      button to save this calibration data.

7. With the free ends of the coaxial cables connected through the double female inline coupler, click on the "read LOOP" button.  After this step, the calibration window will resemble this one.  Click the "Save" button to save this calibration data.

Choose an appropriate file name for the
                      calibration data, enter an optional comment and
                      click the "Save" button to return to the
                      calibration window. You may reload this data file
                      in the future for measurements with these same
                      cables. Click the "Update" button to
                      load the new calibration data into the MiniVNA and
                      to return to the main vna/J window.

8. Choose an appropriate file name for the calibration data, enter an optional comment and click the "Save" button to return to the calibration window.  You may reload this data file in the future for measurements with these same cables.   Click the "Update" button to load the new calibration data into the MiniVNA and to return to the main vna/J window.

Perform a baseline measurement from 100 kHz
                      to 1 MHz with the cables still connected through
                      the double female inline coupler. Type 100,000 in
                      the frequency start field and 1,000,000 in the
                      frequency stop field. Then click on the green
                      "Single" button.

9. Perform a baseline measurement from 100 kHz to 1 MHz with the cables still connected through the double female inline coupler.  Type 100000 in the frequency start field and 1000000 in the frequency stop field.  Then click on the green "Single" button.

After the scan, the graph area displays a
                      transmission loss of 0.00 dB and phase shift of 0°
                      over the frequency range. This validates the
                      accuracy of the calibration.

10. After the scan, the graph area displays a transmission loss of 0.00 dB and phase shift of 0� over the frequency range.  This validates the accuracy of the calibration.

Clicking the "Autoscale" box next
                      to the green "TL (dB)" button amplifies
                      any variations in the measurements to fill the
                      vertical dimension of the graph. The effect here
                      exaggerates the miniscule jitter of measurements
                      around the zero line.

11. Clicking the "Autoscale" box next to the green "TL (dB)" button amplifies any variations in the measurements to fill the vertical dimension of the graph.  The effect here exaggerates the miniscule jitter of measurements around the zero line.

To measure the device, remove the double
                      female inline coupler and insert the device
                      between the free ends of the coaxial cables.

12. To measure the device, remove the double female inline coupler and insert the device between the free ends of the coaxial cables.

Click on the green "Single" button
                      to measure the filter characteristic. This graph
                      shows markers placed at 200, 400, 600 and 800 kHz.
                      The measured 3 dB cutoff frequency is 643 kHz. An
                      abrupt signal phase shift from -180° to +180° is
                      observed at 510 kHz.

13. Click on the green "Single" button to measure the filter characteristic.  This graph shows markers placed at 200, 400, 600 and 800 kHz.  The measured 3 dB cutoff frequency is 643 kHz.  An abrupt signal phase shift from -180� to +180� is observed at 510 kHz.

vna/J can export the measurement data in
                      several formats. I exported this JPEG image of the
                      low pass filter characteristics from 100 kHz to 2
                      MHz. The marker shows the 3 dB cutoff frequency at
                      643 kHz.

14. vna/J can export the measurement data in several formats.  I exported this JPEG image from a scan of the low pass filter characteristics from 100 kHz to 2 MHz.  The marker shows the 3 dB cutoff frequency at 643 kHz.


REFERENCES

  1. vna/J User Guide, Krause, D, DL2SBA
  2. A Low Pass Filter in an Altoids Box, Milazzo, CF, KP4MD
  3. 10 MHz Low Pass Filter Performance Test with miniVNA, Milazzo, CF, KP4MD
  4. Measuring a HF Low Pass Filter Using the MiniVNA PRO, Bail, J, NT1K
Return to KP4MD Home Page
Top