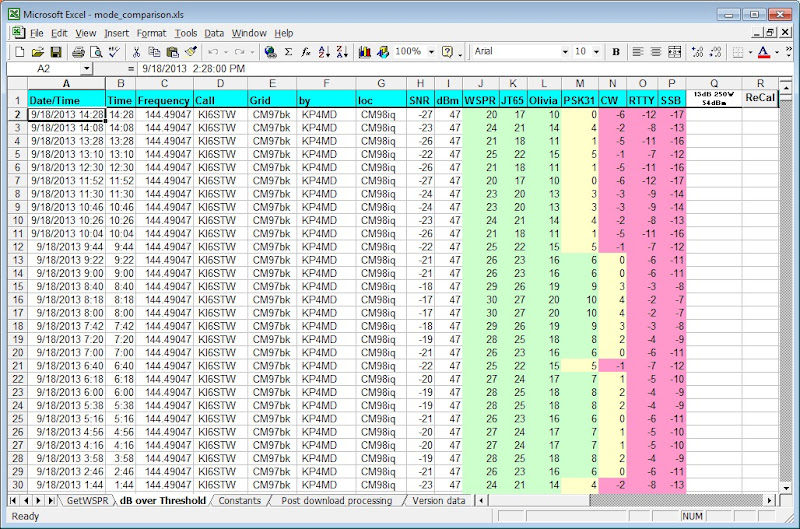
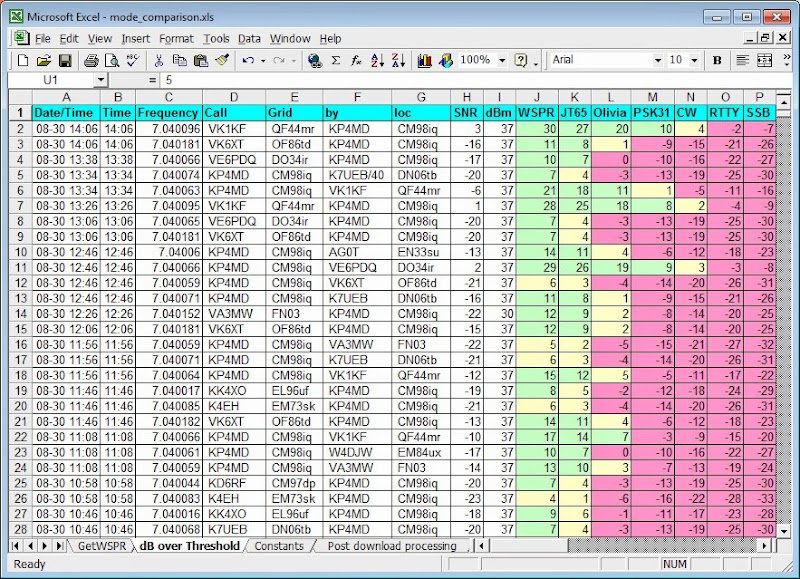
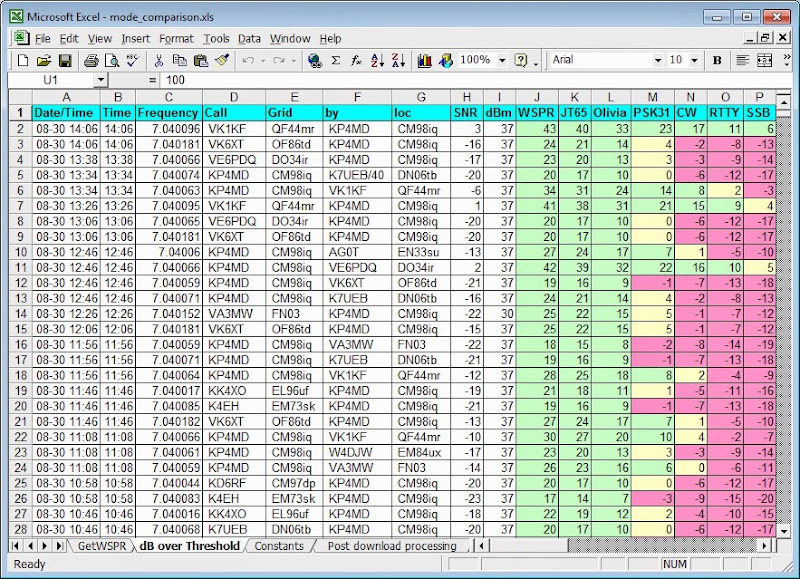
INTRODUCTIONThe Weak Signal Propagation Reporter (WSPR) Network is an open worldwide network of amateur radio stations using the WSPR digital communication mode conceived by Dr. Joseph Taylor, K1JT. The WSPR mode is designed to probe potential radio propagation paths with low-power transmissions. Each WSPR transmission carries encoded the originating station's callsign, Maidenhead grid locator, and transmitter power in dBm. The WSPR program1 can decode signals with a signal to noise ratio (SNR) as low as -28 dB in a 2500 Hz bandwidth. Stations with a personal computer, a single sideband transceiver and internet access can automatically upload their reception reports to a central database at http://wsprnet.org2 that includes lists of active stations, forums, statistics and a mapping facility. RELATING WSPR SPOT REPORTS TO OTHER MODESThe WSPRnet.org database hosts a large and detailed, instantly accessible repository of historic and real time data on radio propagation conditions. These data may be used, in theory, to estimate when current conditions would support communication using other modes based on the relative sensitivity of WSPR to those modes. Figure 1 lists some published signal to noise ratio thresholds in a 2500 Hz bandwidth for various communication modes in current use and the calculated transmitter power needed to achieve equivalent communication with each mode under the same propagation conditions.* For example, a radio circuit that supports a 5 watt WSPR transmission at threshold would theoretically require an effective 37 dB power increase, or 25,000 watts, to accomplish the same communication using the single sideband (SSB) voice mode. APPLYING WSPR SPOT DATA TO OTHER MODESOne criticism of the WSPR network data has been that it cannot be used to indicate usable propagation conditions for other modes. However, WSPR spot report data may be used to estimate the probability of communication over a particular circuit when these data are normalized for station transmitter power, antenna gain and the relative sensitivities of alternative modes. The following formula estimates the signal strength above threshold for other communication modes based on WSPR spot report data between two stations (all units in dB and dBm). Signal above Threshold = WSPR Spot SNR + WSPR Threshold - Mode Threshold + Transmitter Power - WSPR Spot Power + Antenna gain - WSPR Antenna gain Mark Hughes, GM4ISM, has written and published macro code in a Microsoft Excel spreadsheet3 that retrieves a user specified subset of data from the WSPRnet.org online database. I have added calculations to this spreadsheet4 that tabulate and display the expected signal strengths above threshold for the various communication modes over the paths for each WSPR spot report. Note: This Microsoft Excel spreadsheet requires support for Visual Basic macros and may not work with Excel program clones. The desired WSPR spot report data is initially retrieved by clicking on the "Get Web data" button on the "GetWSPR" worksheet. Clicking on the "Ant Gain/Power" button will allow the user to specify the antenna gain in dB (relative to the WSPR station antenna) and transmitter power in watts that will be used for the data calculations. Clicking on the "Mode Comp" button then transfers the WSPR report data to the "dB over Threshold" worksheet and calculates and displays the comparison data. Figure 2 shows these calculations on some 7 MHz WSPR spot reports normalized for a 5 watt transmitter power, and Figure 3 show those reports normalized for 100 watt transmitter power. Columns A through I contain the downloaded WSPRnet.org data. Columns J through P contain the calculated signal strength over threshold for each mode, with each cell color highlighted through conditional formatting. The spreadsheet cells that contain values below the threshold that are not expected to support communications are highlighted in red. The values that are 6 dB (1 S unit) or higher above the threshold are highlighted in green, and the intermediate values are in yellow. The user may use the spreadsheet menu controls to sort and filter the displayed data as desired. By clicking on the "ReCalc" button, the user can repeatedly input an alternative antenna gain in dB (relative to the WSPR station antenna) and transmitter power in watts into cells T1 and V1 (scrolled off the screen) and display the calculations for the new parameters on the worksheet. The data presented in this manner facilitates
comparison of radio propagation conditions to stations
in the same and different regions of the world and shows
expected variations in signal strength over time and
some variations in reciprocity of reported signal
strengths over some paths. Sources for these
variations may include:
* The signal to noise ratio thresholds for these
communication modes vary depending on
the investigator and method of determination.
Several of these are listed in references 6-9 below. REFERENCES
|
|
|||||||||||||||||||||||||||
|---|---|---|---|---|---|---|---|---|---|---|---|---|---|---|---|---|---|---|---|---|---|---|---|---|---|---|---|---|
 |
 |
|---|---|
| 1. After entering the reported call, spotter call and specifying the desired band in the blue fields, a click on the gray gears in the Get Web Data box retrieves the specified number of recent spots for this radio circuit. To display (or change) the station parameters for the comparison calculations, click on the gray "Ant Gain/Power" button. The relative antenna gain was specified as 0 dB (relative to the WSPR system antenna) and the transmitter power as 50 watts in this example. This screenshot was taken prior to clicking on the "Mode Comp" button to display the following worksheet. | 2. Here are the circuit calculations for a relative antenna gain of 0 dB and 50 watts transmitter power. Columns A through I contain the downloaded WSPRnet.org data. Columns J through P contain the calculated signal strength over threshold for each mode, with each cell color highlighted through conditional formatting. The values below the threshold that are not expected to support communications are highlighted in red. The values that are 6 dB (1 S unit) or higher above the threshold are highlighted in green, and the intermediate values are in yellow. |
 |
 |
| 3. Click on the grey "ReCalc" button to estimate circuit performance with alternative power and relative antenna gain figures. Here is the estimated circuit performance for 250 watts transmitter power and a 13 dB increase in antenna gain. The "ReCalc" button may be used repeatedly to view calculations for different system parameters. | 4. The comparison modes and their respective thresholds can be specified otherwise on the "Constants" worksheet. This sheet also displays statistics for each downloaded data set. |

