|

note ***: The B2016+28 and the B2020+28 are only about 1deg apart from each other. 424 MHz profiles for both pulsars were obtained by analyzing the same recorded file. |
 |
| Pulsar | 70cm (420 MHz) | 23cm (1292 MHz) |
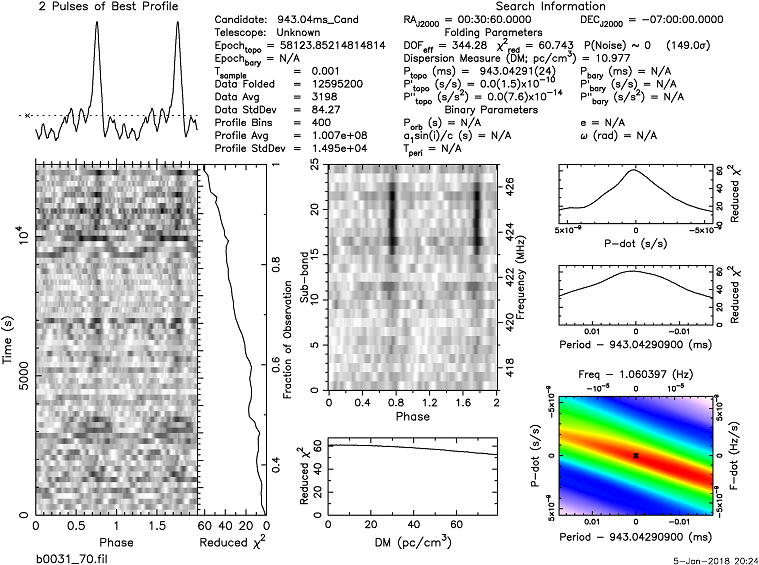
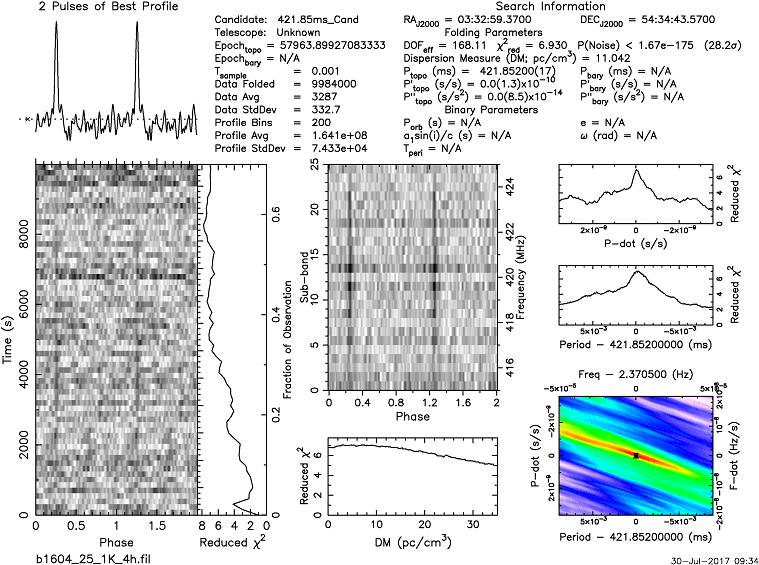
| B0031-07 | S400=52 | --- |
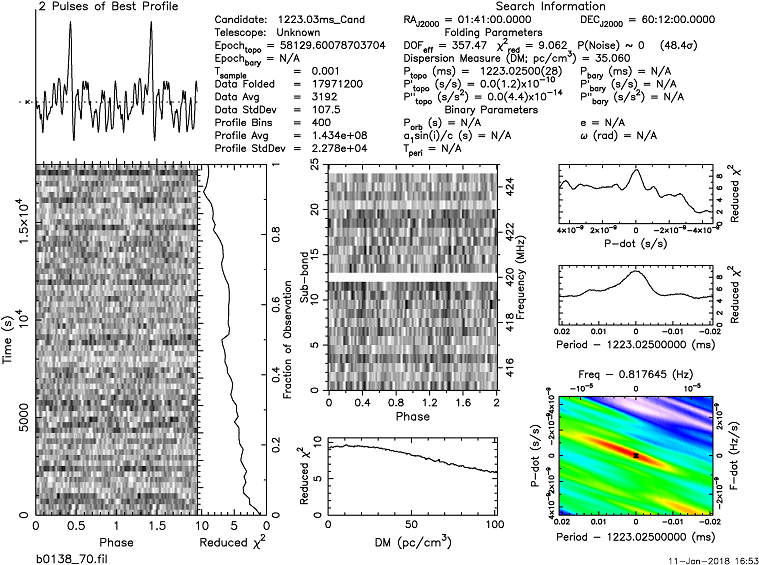
| B0138+59 | S400=49 | --- |
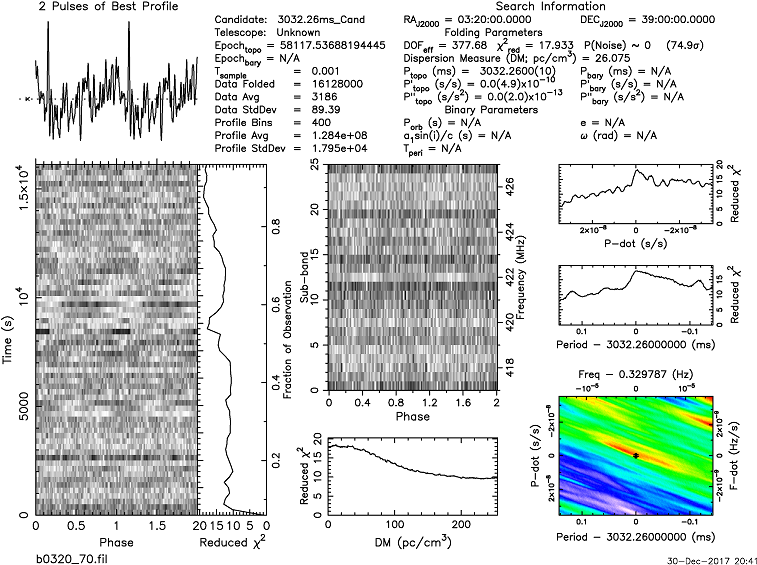
| B0320+39 | S400=34 | --- |
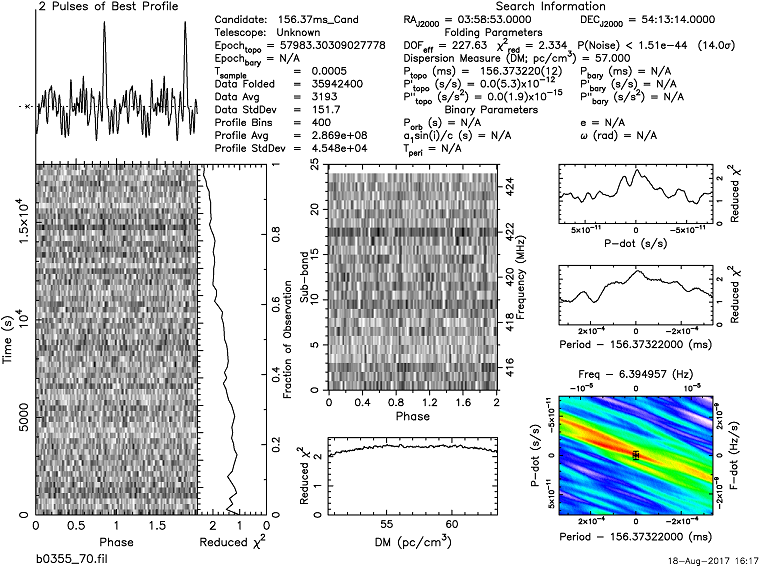
| B0355+54 | S400=46 | --- |
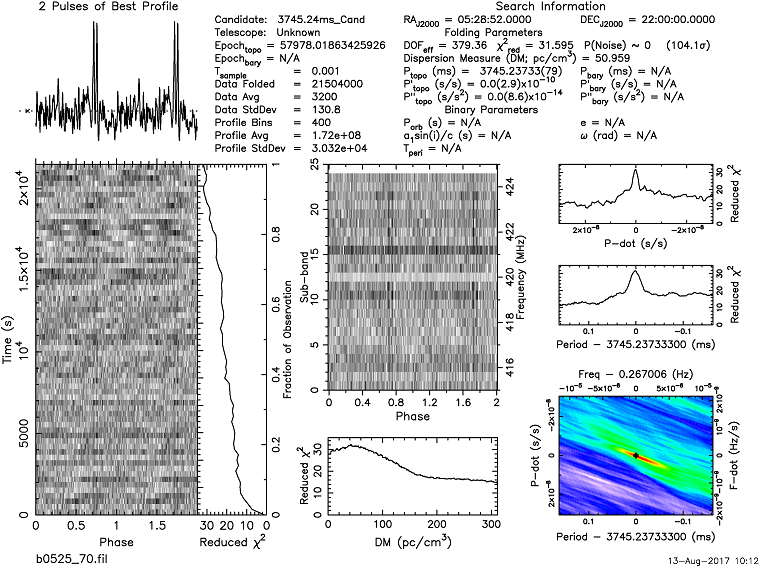
| B0525+21 | S400=57 | --- |
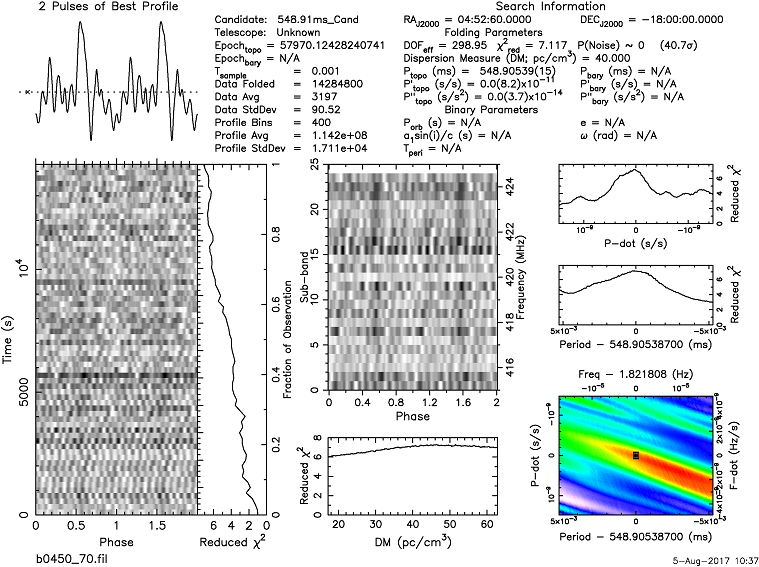
| B0450-18 | S400=82 | --- |
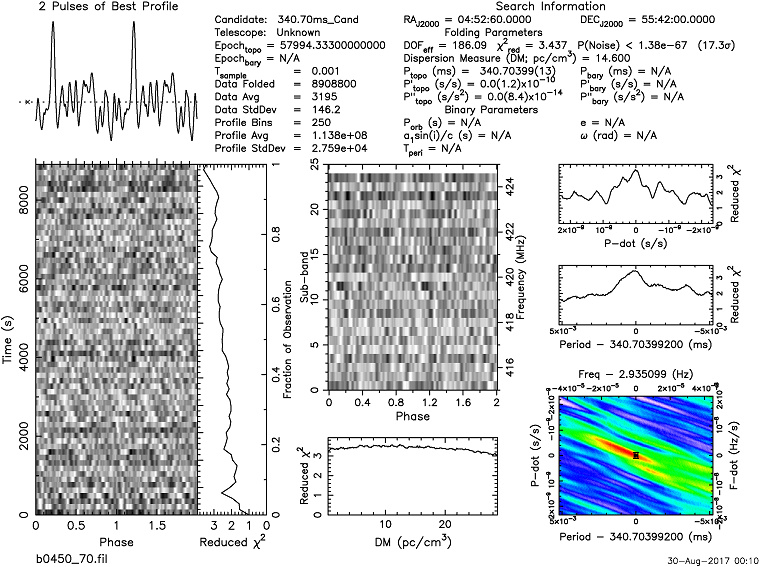
| B0450+55 | S400=59 | --- |
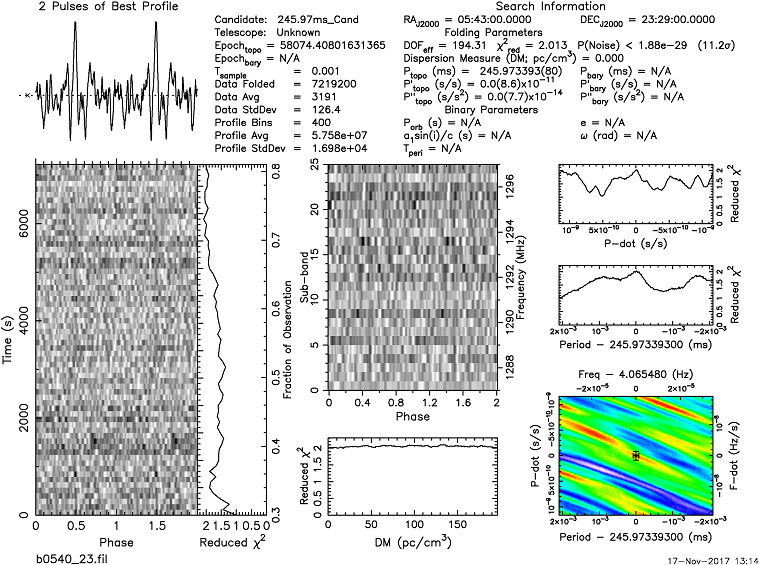
| B0540+23 | --- | S1400=9 |
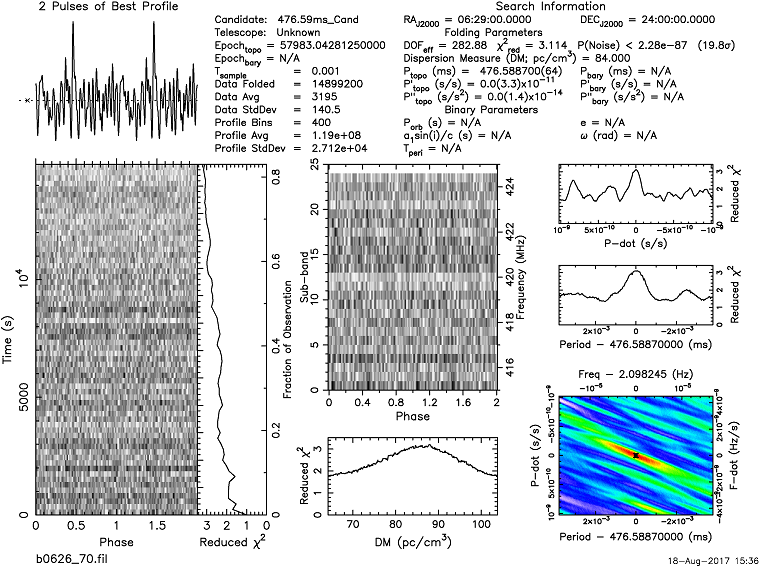
| B0626+24 | S400=31 | --- |
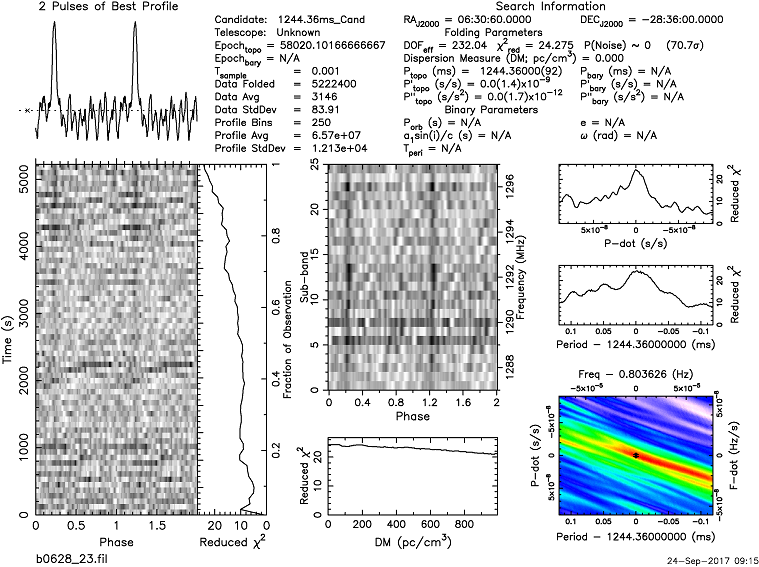
| B0628-28 | --- | S1400=23 |
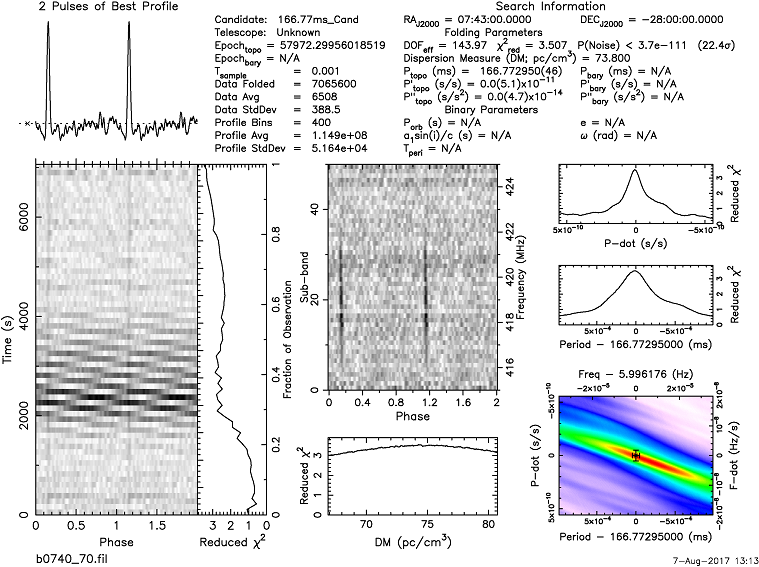
| B0740-28 | S400=296 | --- |
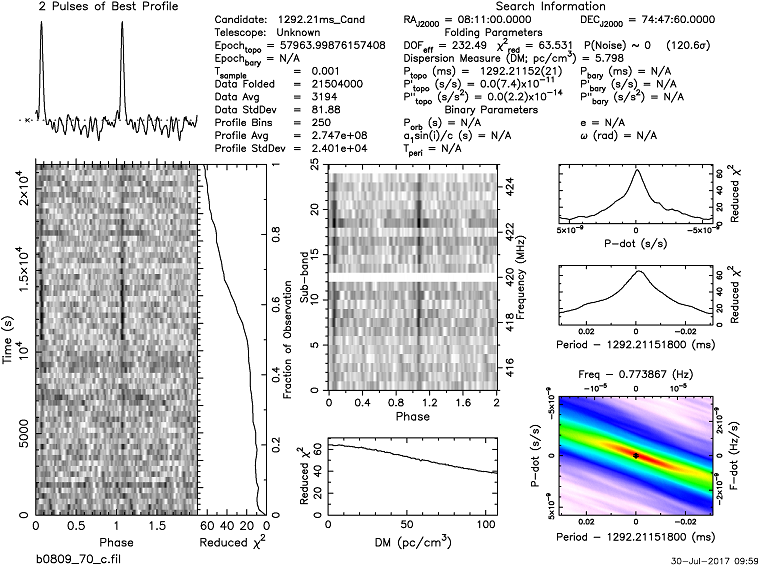
| B0809+74 | S400=79 | --- |
| B0818-13 | S400=102 | --- |
| B0919+06 | S400=52 | --- |
| B1540-06 | S400=40 | --- |
| B1541+09 | S400=78 | --- |
| B1604-00 | S400=54 | --- |
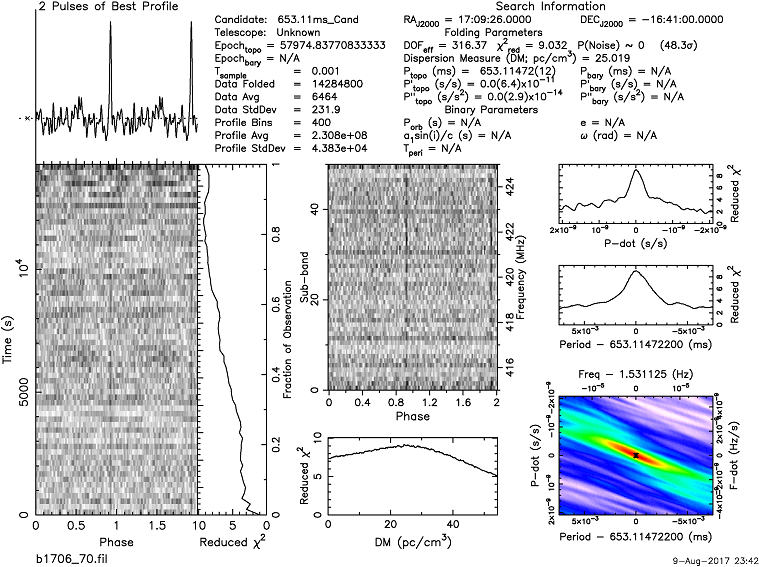
| B1706-16 | S400=47 | --- |
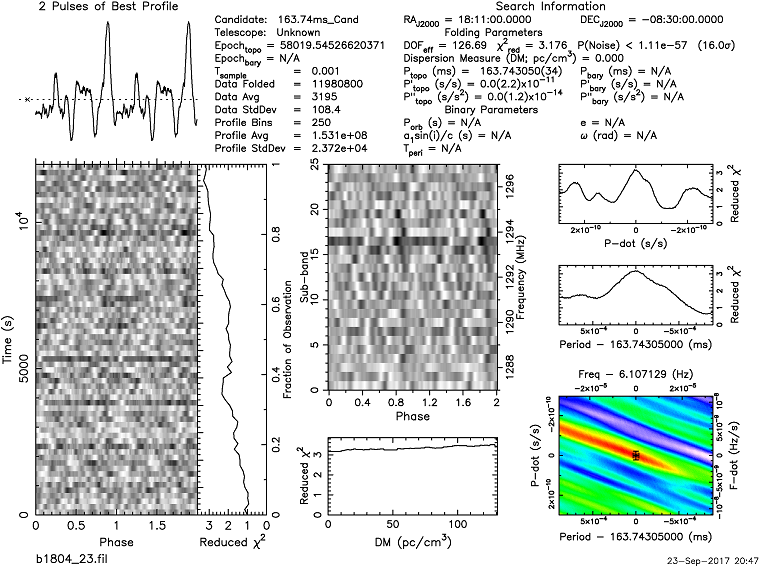
| B1804-08 | --- | S1400=15 |
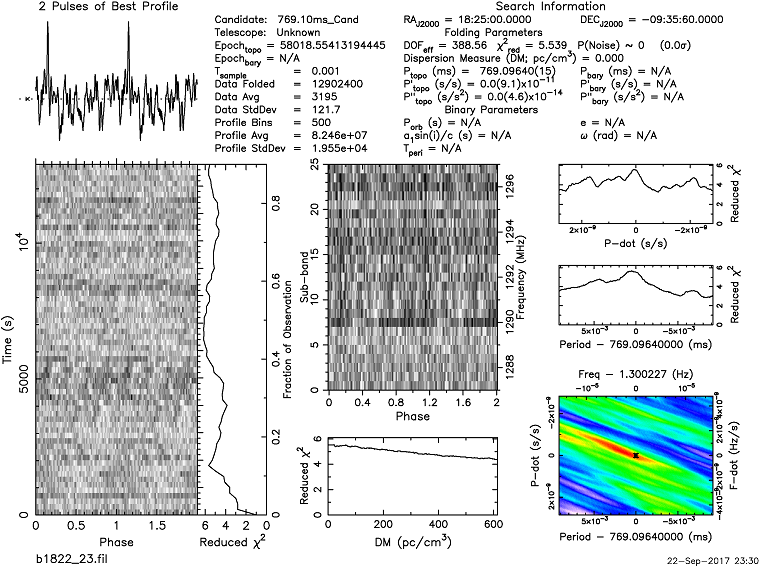
| B1822-09 | --- | S1400=12 |
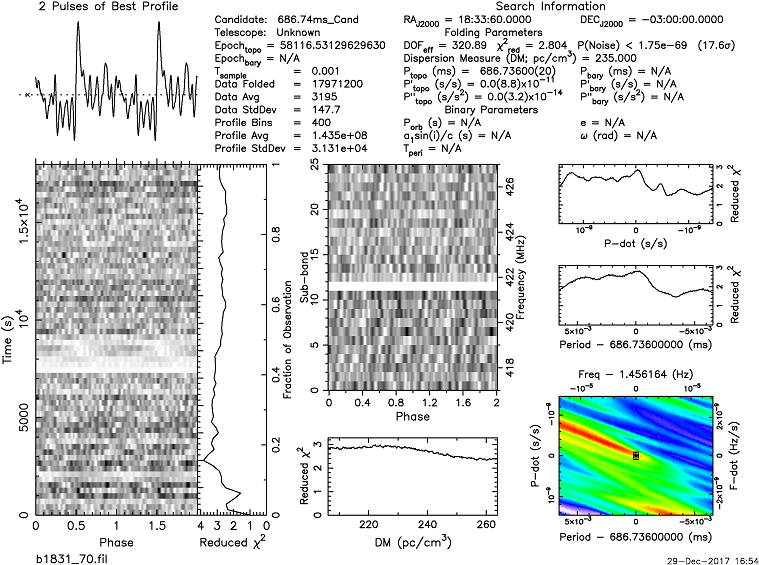
| B1831-03 | S400=89 | --- |
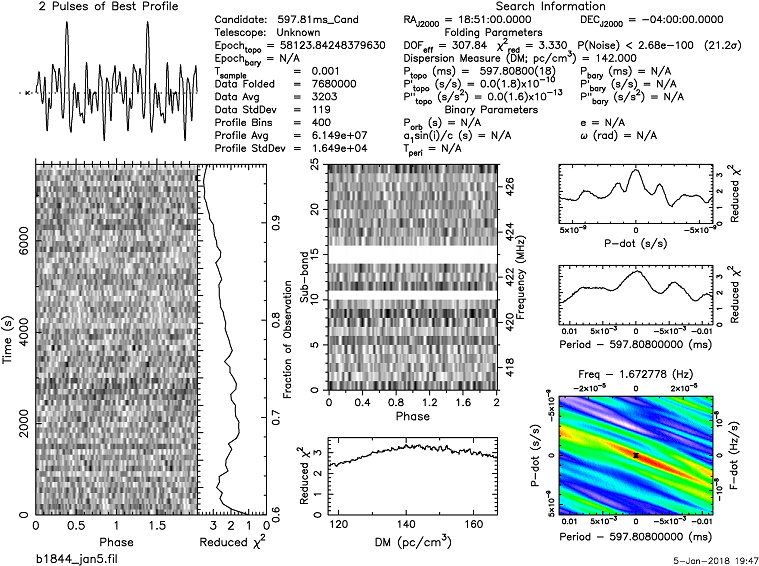
| B1844-04 | S400=75 | --- |
| B1845-01 | --- | S1400=8,6 |
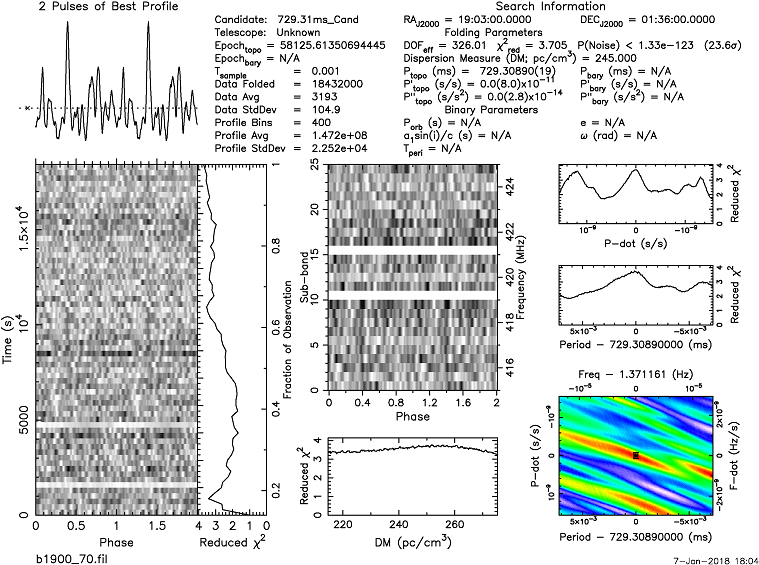
| B1900+01 | S400=58 | --- |
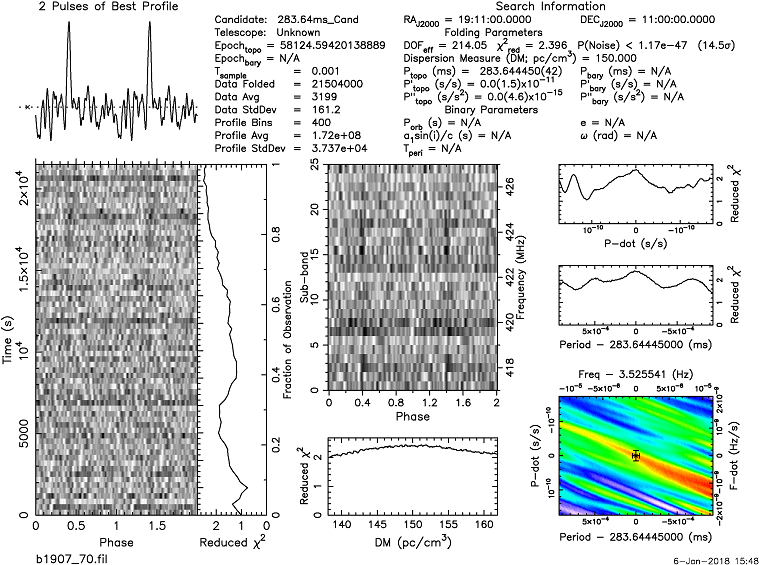
| B1907+10 | S400=50 | --- |
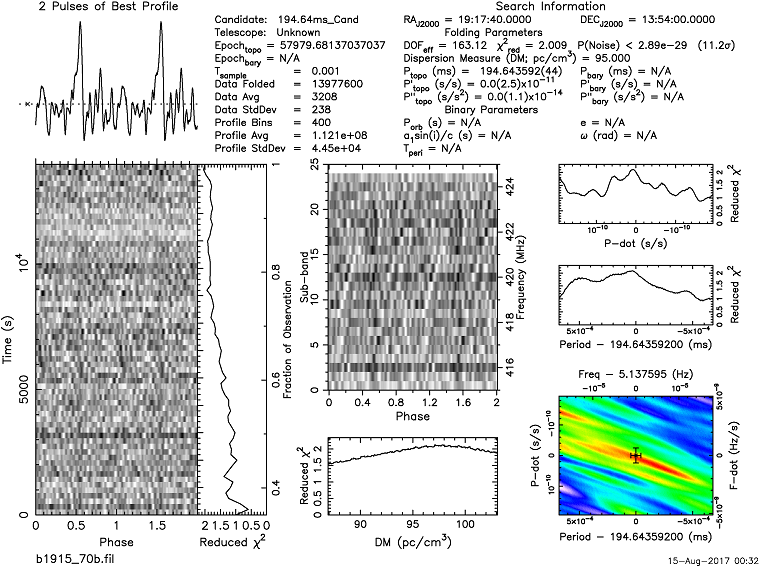
| B1915+13 | S400=43 | --- |
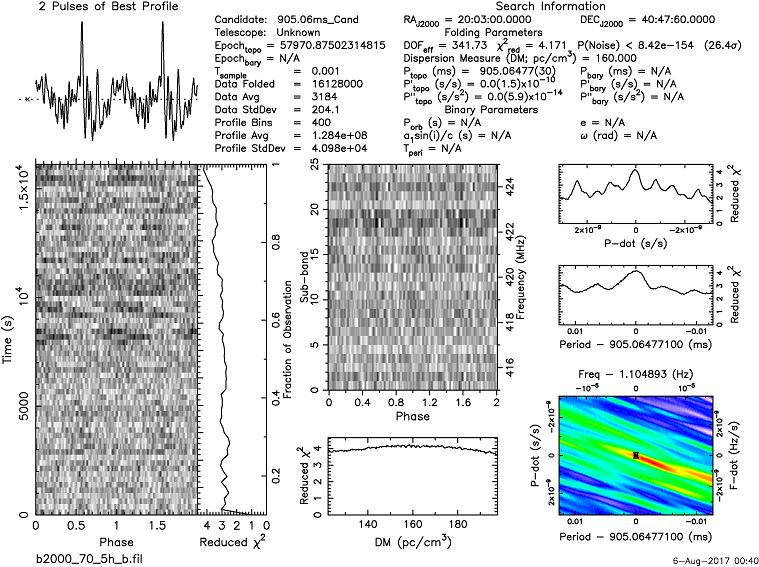
| B2000+40 | S400=53 | --- |
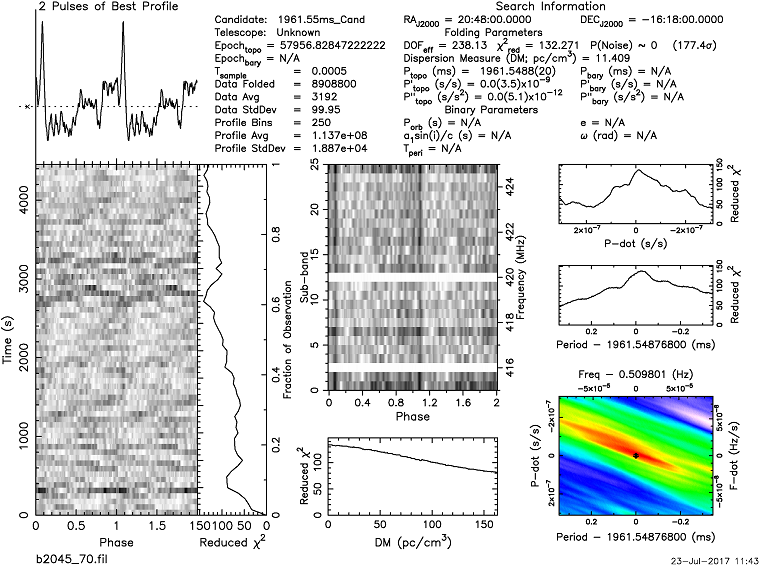
| B2045-16 | S400=116 | --- |
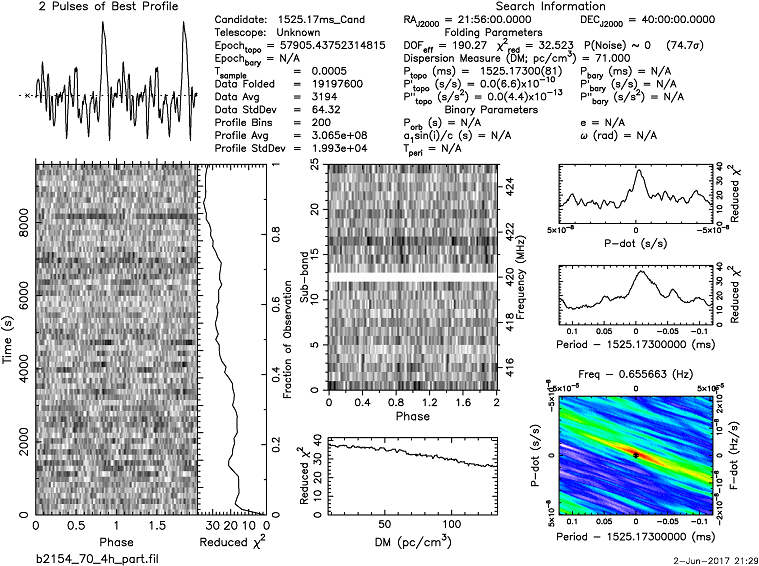
| B2154+40 | S400=105 | --- |
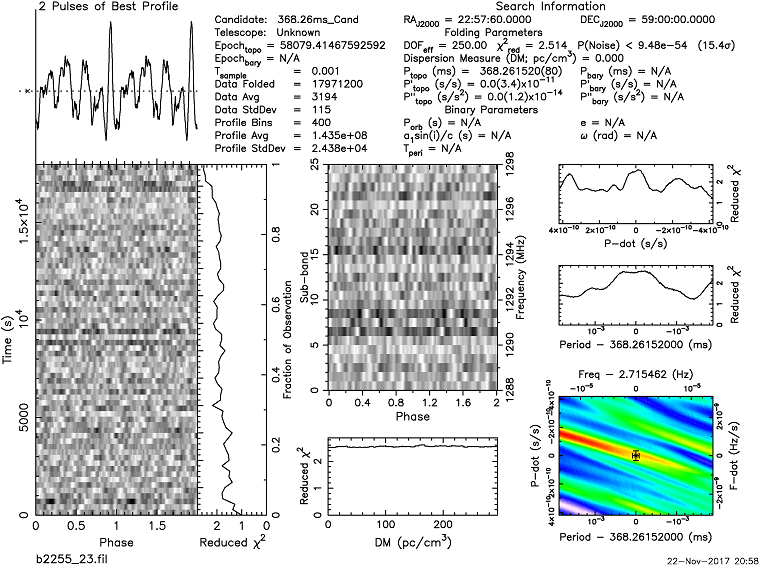
| B2255+58 | --- | S1400=9 |
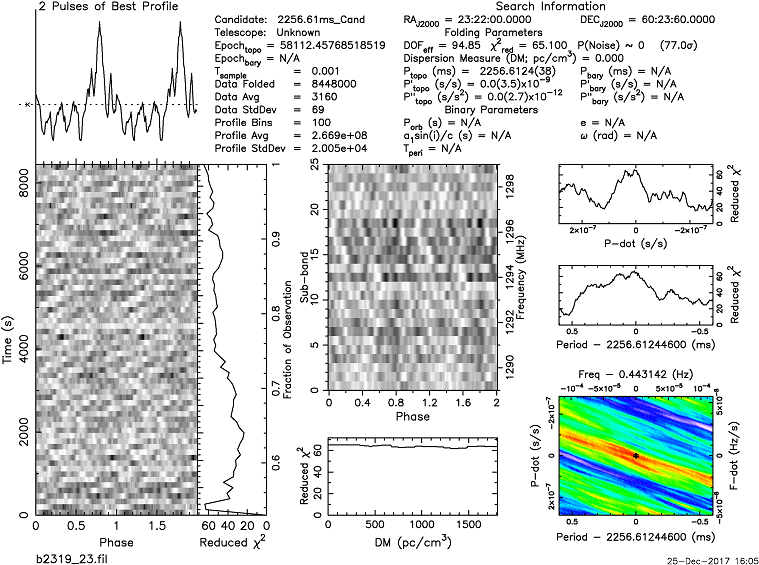
| B2319+60 | --- | S1400=12 |
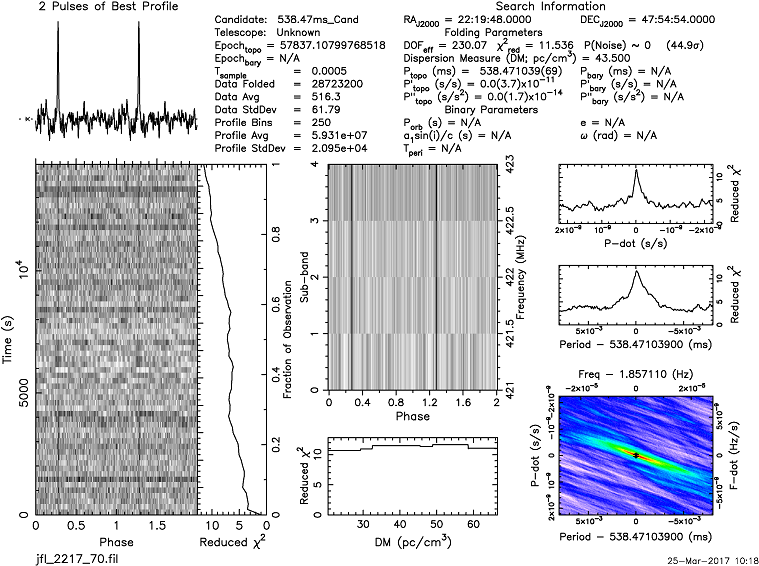
Status January 2018: 54 pulsars detected ( 47 on 420MHz, 18 on 1292MHz, 11 on both bands )
|
|
For
receiving this strong
pulsar on 424MHz, I need normally only one minute or even less. Sometimes it is even possible to get single pulses. With an integration time of several hours, the S/N of course improves a lot. |
||
|
|
Scintillation can be a problem, especially on
23cm. Sometimes nothing for hours, then suddenly the pulsar is showing
up. The whole plot is 5 hours. |
|
|
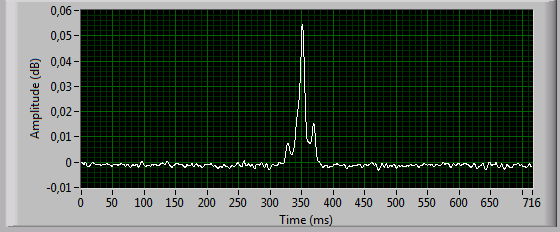 |
In
this 23cm reception the pre-pulse and post-pulse of the B0329+54 normal
mode can be seen very well. |
|
|
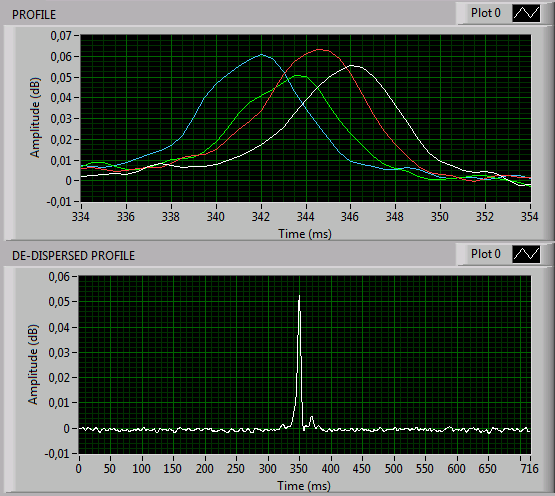 |
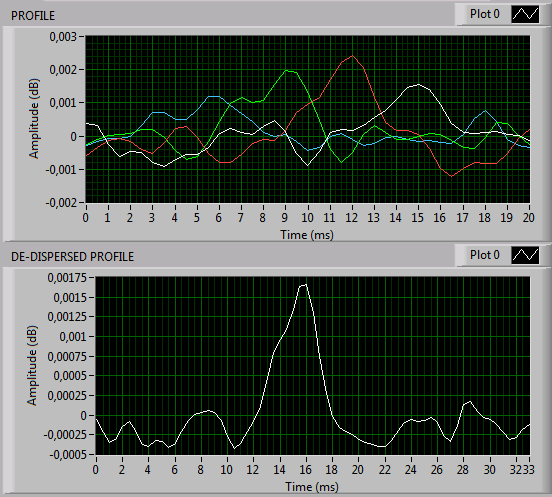
These graphs of a 424MHz reception illustrate
the effect of dispersion. The bandwidth of 2 MHz is divided into 4
subbands, 500 kHz each. The upper graph shows the subbands separately
and zoomed. The blue line is offset by slightly more than 4 ms from the
white line. The difference of the center frequencies is 1.5MHz. This is
a good coincidence to the 2.9ms/MHz dispersion of the pulsar on 420
Mhz. The lower graph shows a beautiful pulse after
de-dispersion. |
|
|
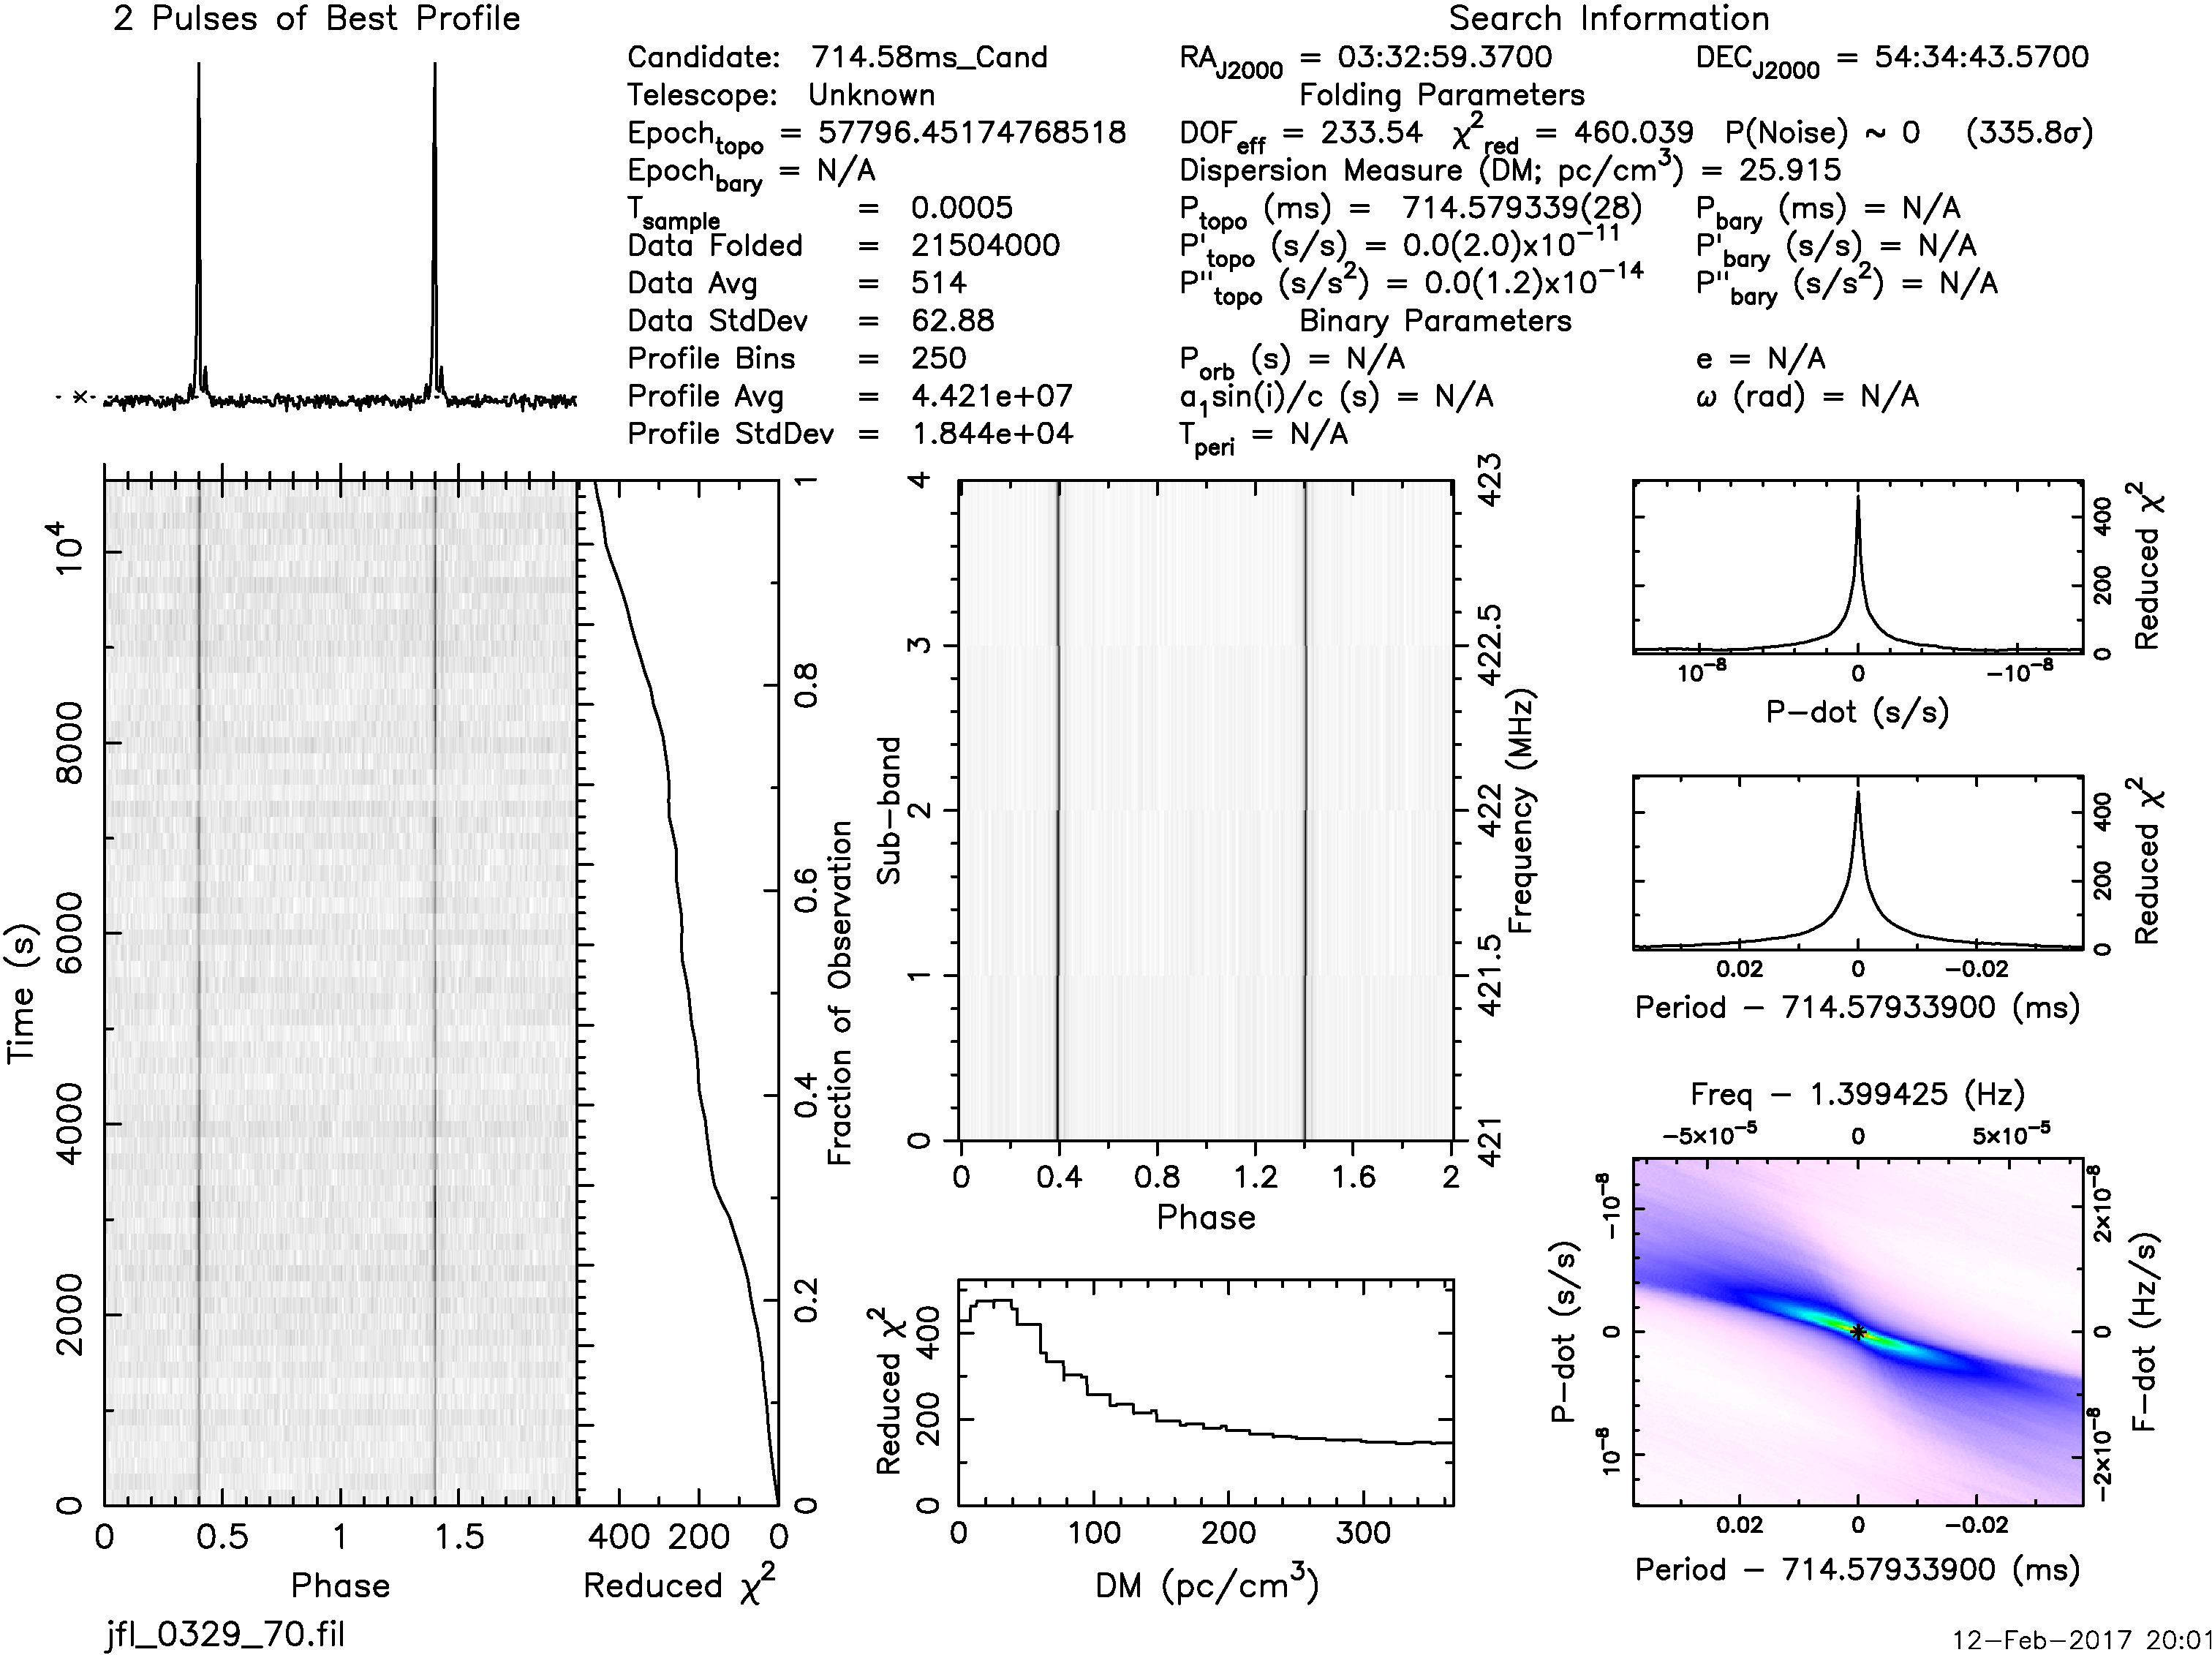 |
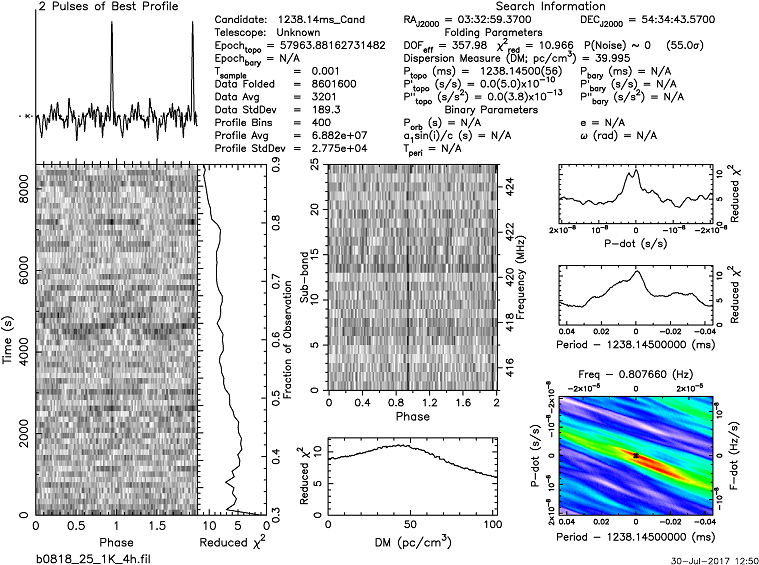
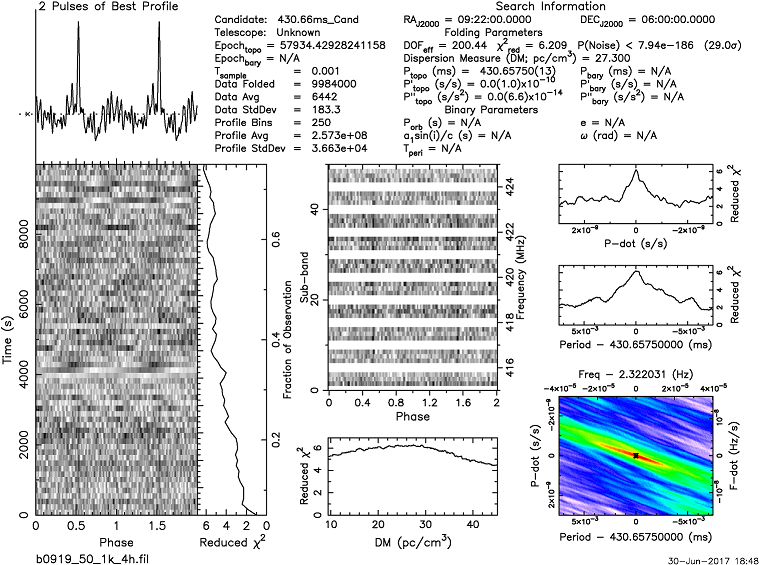
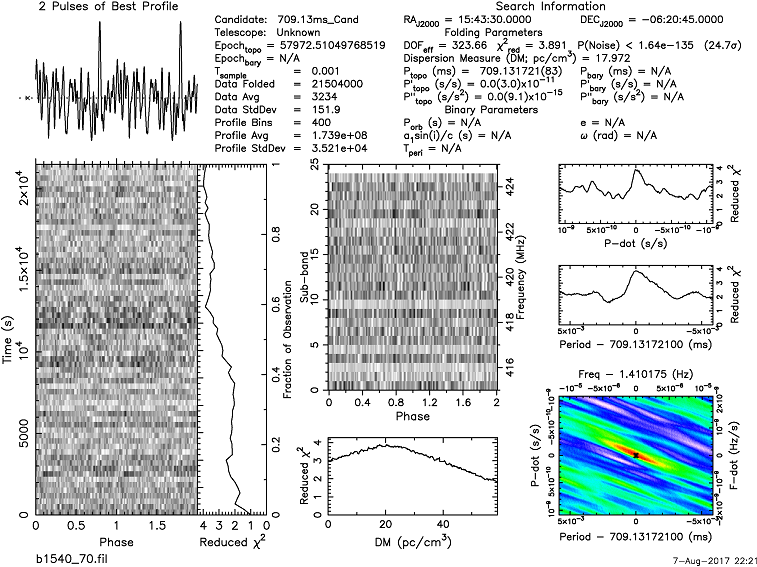
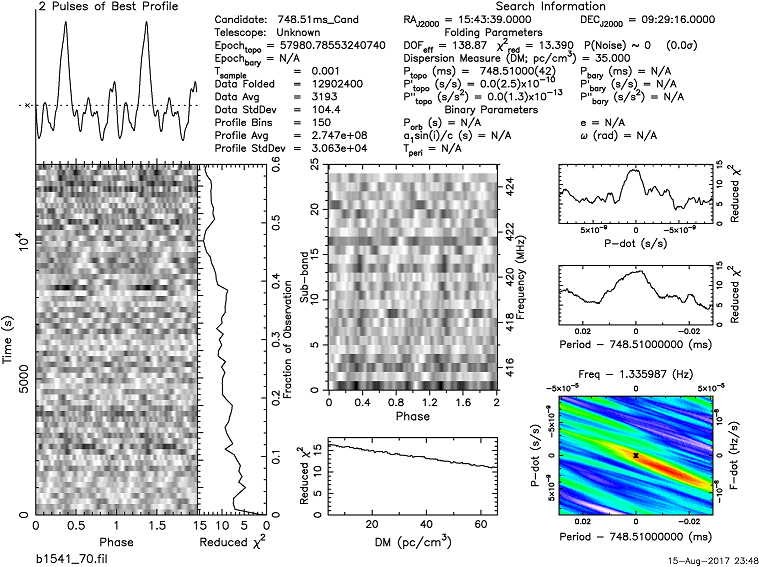
Another good software is Presto.
See the 424 MHz profile of B0329+54.... |
||
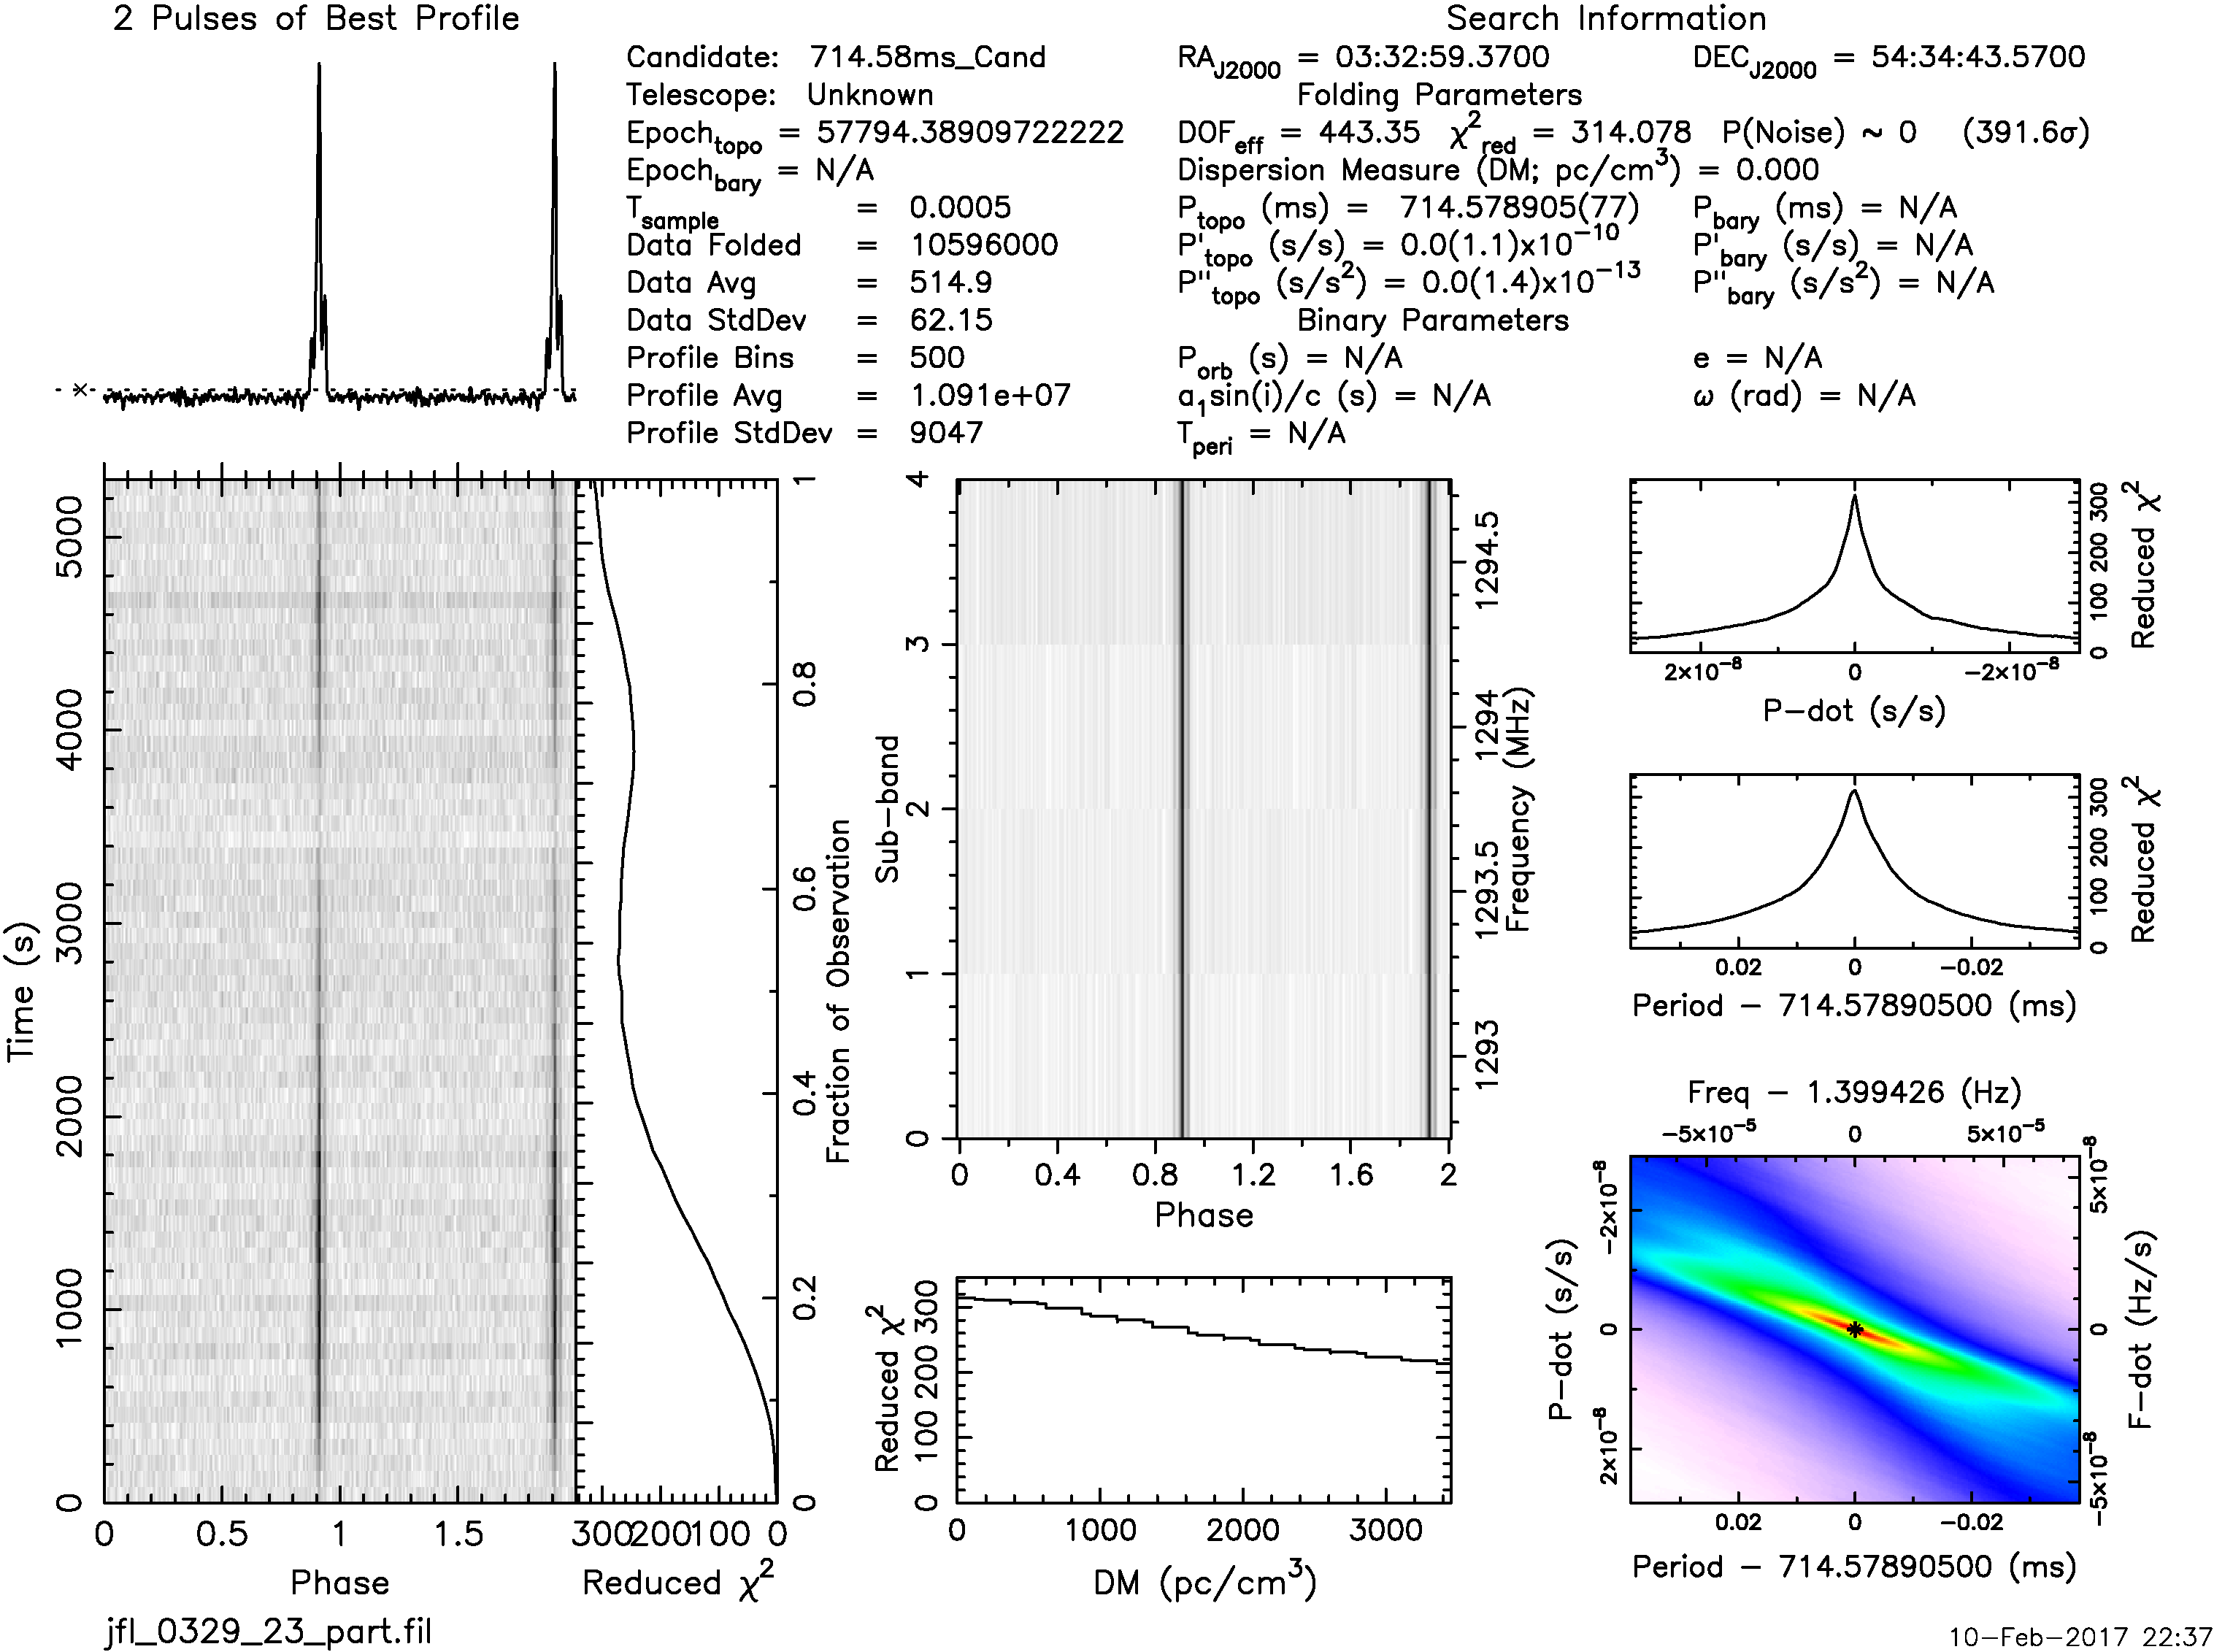 |
.....and the 1294 MHz profile of B0329+54 | ||
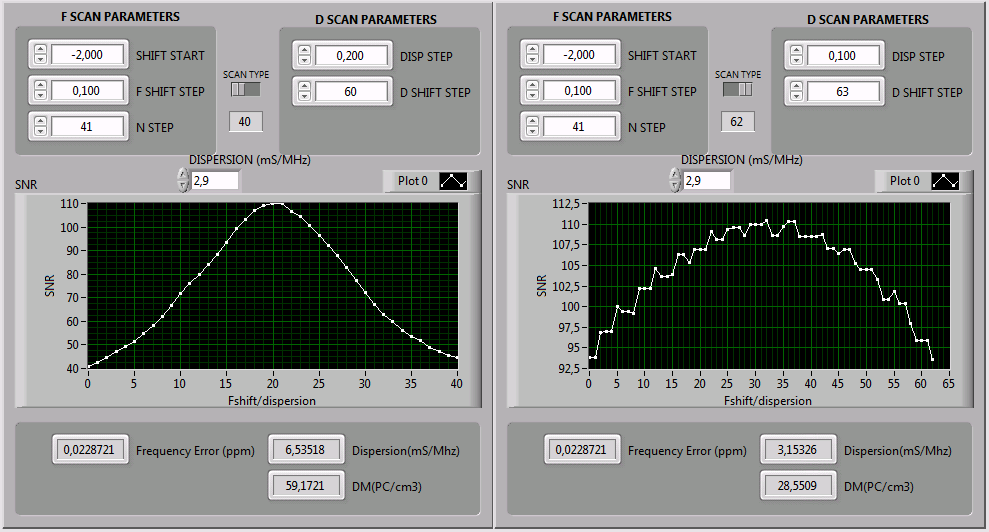 |
IW5BHY has programmed a nice tool to confirm if
the pulses are likely to come really from a pulsar and not RFI. The
folding time is shifted (useful on 70cm and 23cm) and the dispersion
time (useful only on 70cm). For an example I made these tests for the 424
MHz recording of the B0329+54. The left picture shows S/N depending on
shifting the folding frequency, in the right picture the dispersion
time is shifted. |
||
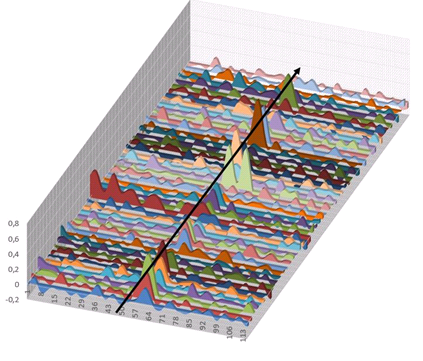
Andrea, IW5BHY, has found 50
single pulses in a one hour recording I made on 424 MHz. With a special
written
program he
put the single pulses in a row, and generated an audio file from that.
This 3D plot displays 50 consecutive periods at a peak of positive scintillation. It is from one piece of observation of 36 seconds containing many single pulses. |
 |
Also produced by IW5BHY, harmonic analysis of the dedispersed timeseries showing the fundamental and two harmonics:

 |
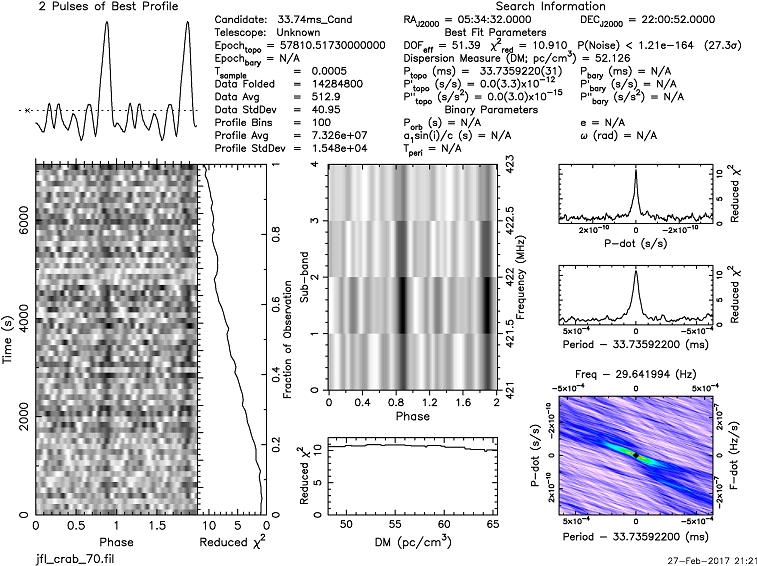
The reception of the Crab-pulsar B0531+21 was
one of the highlights! This young pulsar exists since
a supernova explosion in 1054, which was observed on earth as a star
even
visible at daylight for about two years. It rotates 30 times per
second, is highly dispersed ( 3 ms per channel is the same as the pulse
width) and
its slowdown in rotation speed is remarkable. Nevertheless, the pulsar reception was positive even on the very first attempt! The observation time in that case was two hours. Beside the main pulse the Crab pulsar has an interpulse which is varying in strength. In this reception it is not present. |
 |
| 424 MHz, S/N=10 |
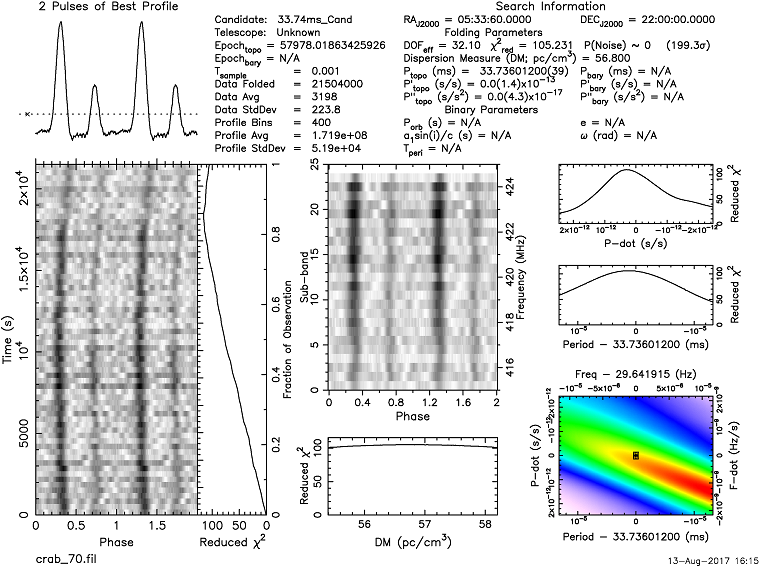 Crab main pulse and interpulse (no frequency
tracking, curve bent)
|
After
an 6 hours observation of the much weaker pulsar B0525+21 I was looking
for the Crab pulsar in this file also, because their positions are
close to each other. There was low RFI during that time, so both pulsars signals came through nicely. Because of the long observation time the Doppler effect was noticable and the curve was somewhat bent. With the frequency tracking option of Presto the curve is straightened and S/N even better. |
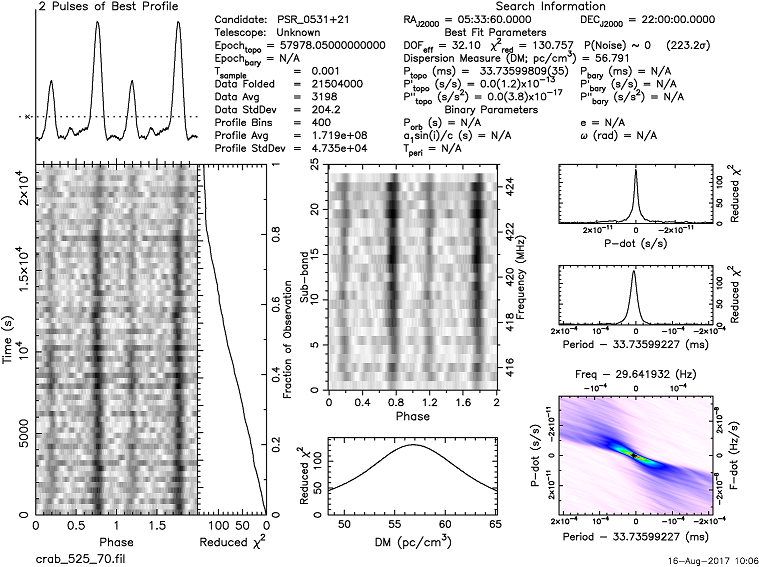 same as on the left side, but with frequency tracking, curve straight |
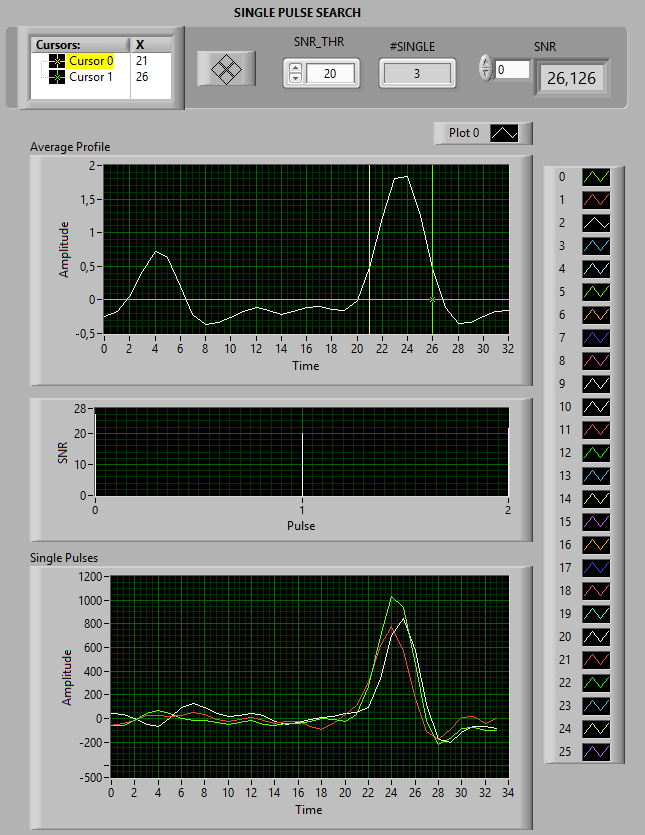 Best 3 giant pulses during a 6 hours observation. Threshold for S/N=20, best S/N=26 |
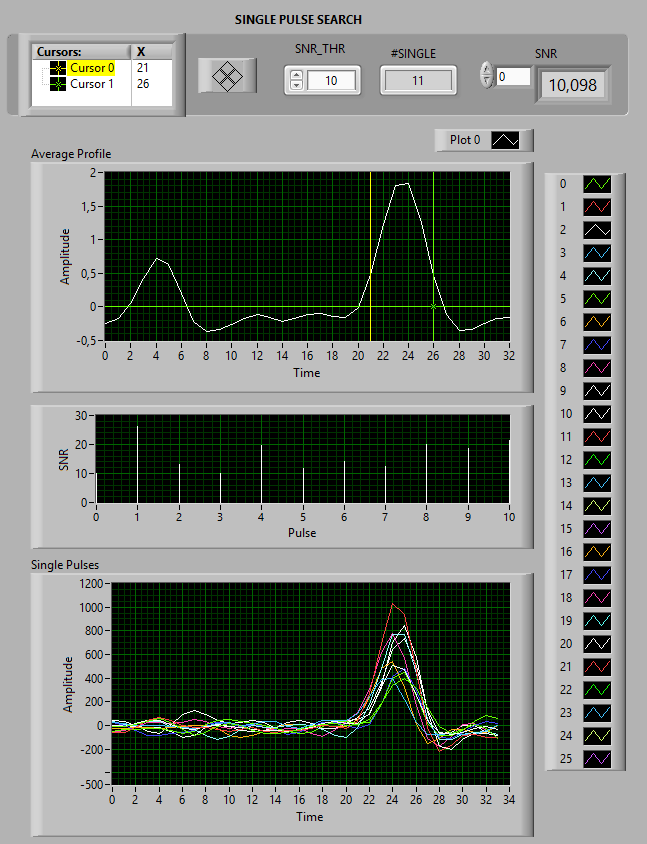 Best 11 giant pulses during a 6 hours
observation.
Threshold reduced to S/N=10 |
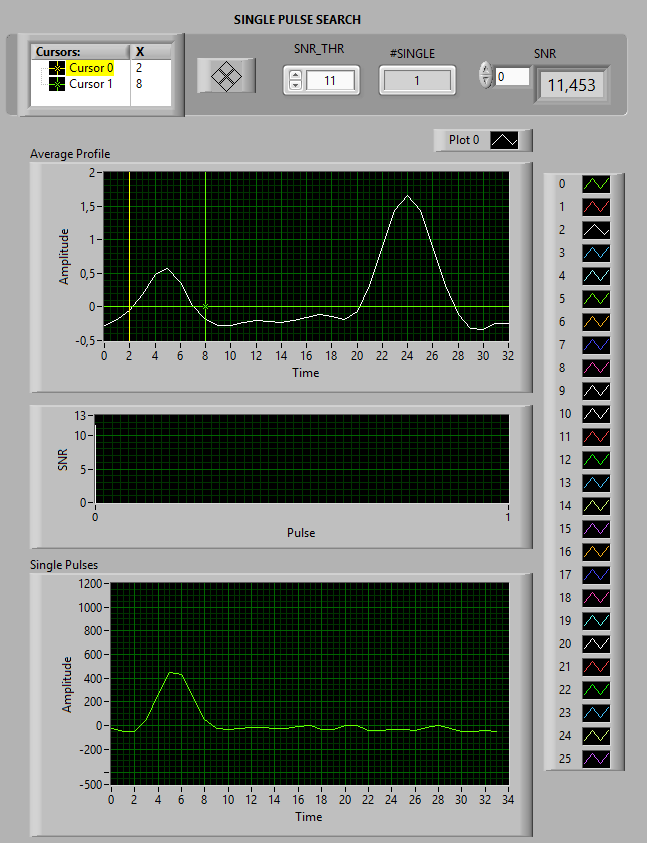 One giant pulse was found at the
phase of the interpulse.
This is a very rare event! |
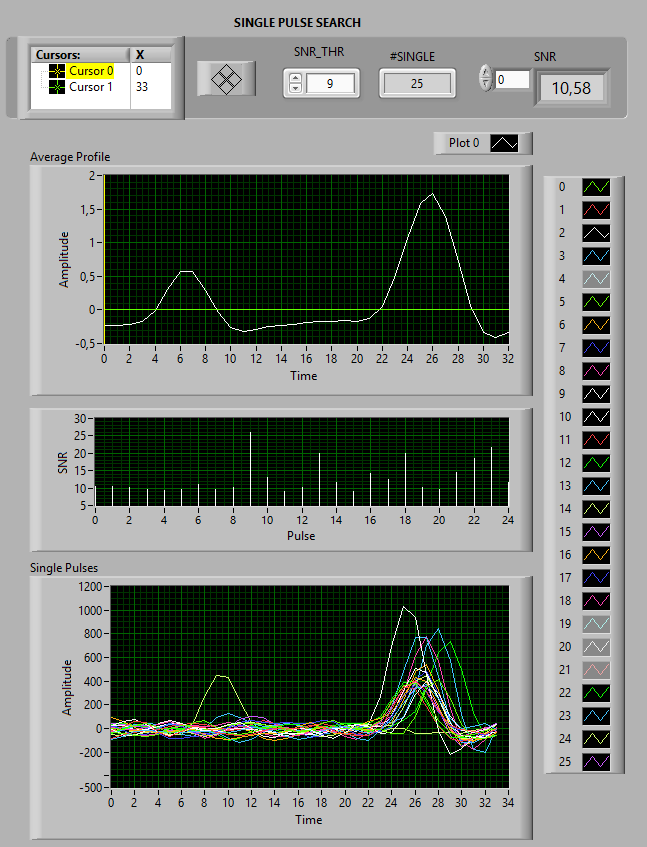 Best 25 giant pulses during a 6 hours observation. Threshold reduced to S/N=9 The phase of the giant pulses is not constant, because during 6 hours of observation Doppler shift is significant. |
 |
||
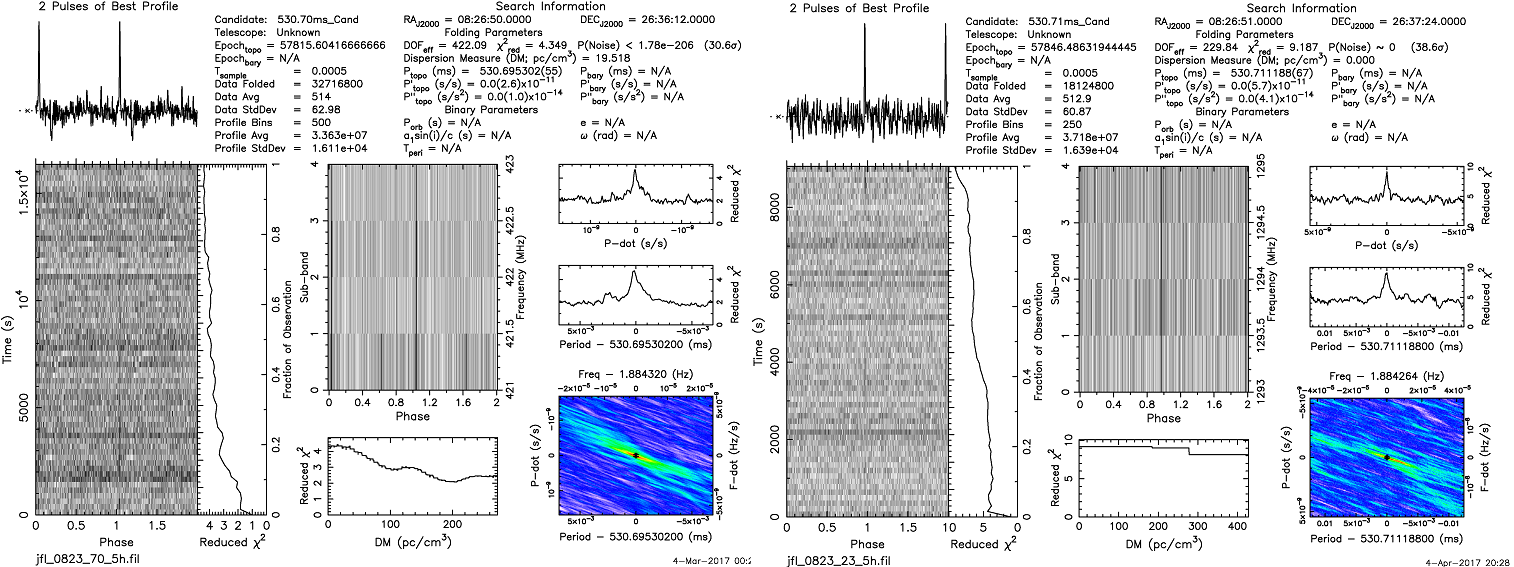
| left side: 424 MHz right side: 1294 MHz |
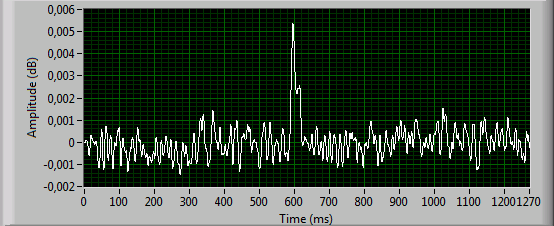 424 MHz, S/N=10 |
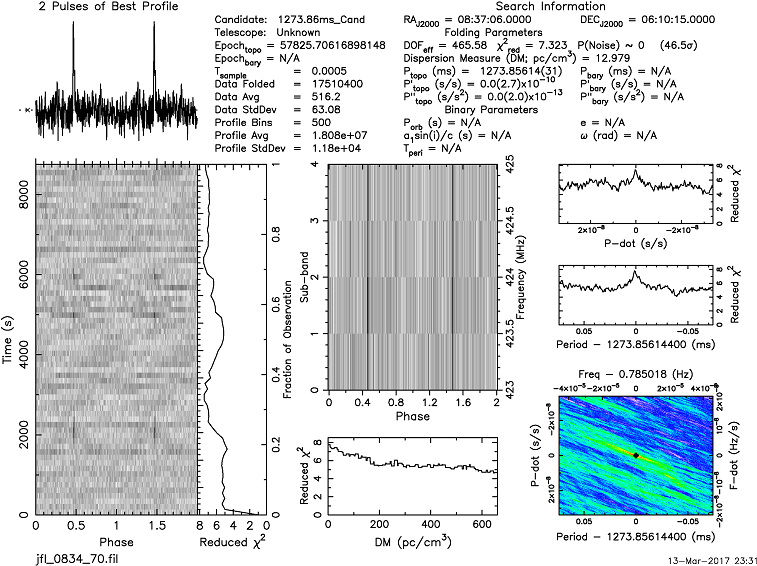 |
|
 |
||
|
|
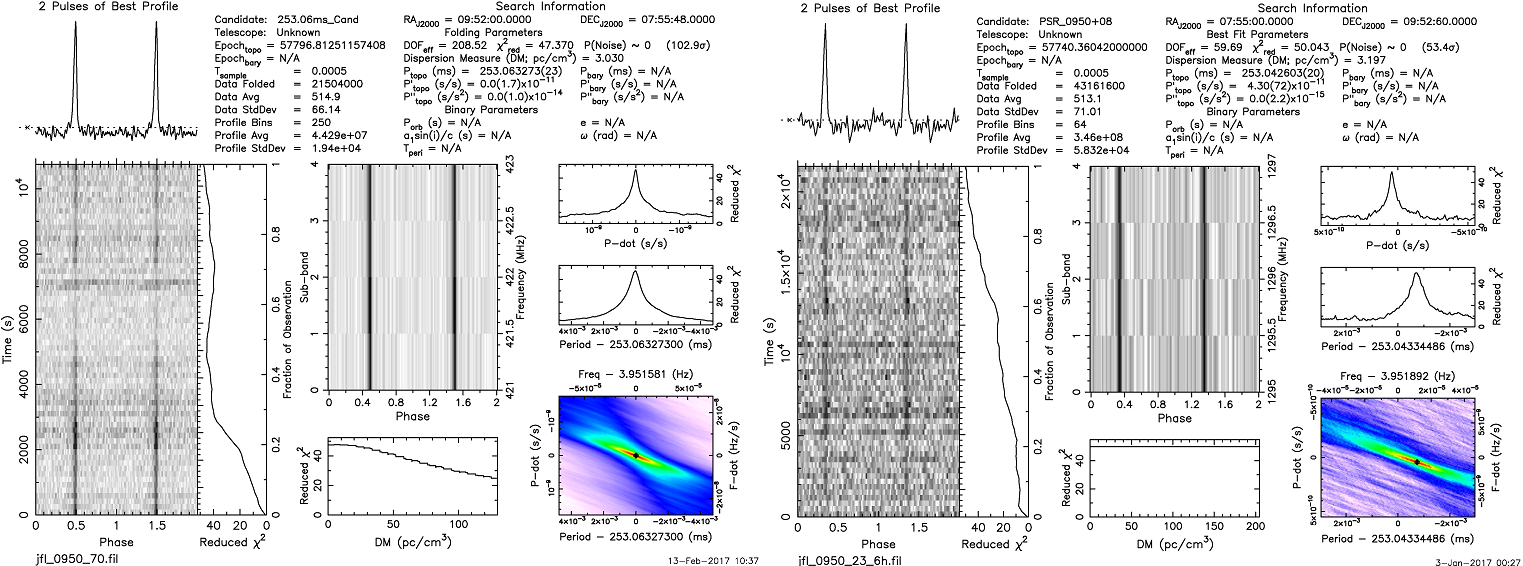
left side: 424 MHz right side: 1294 MHz |
|
|
 |
|
|
|
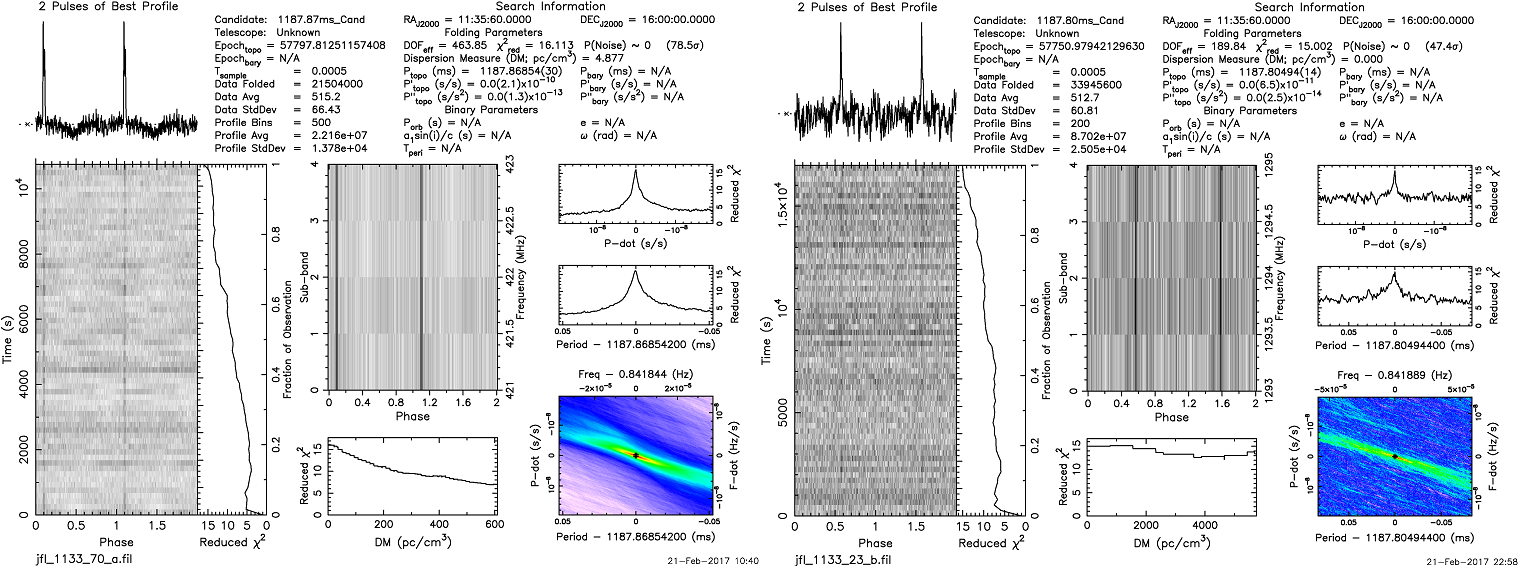
left side: 424 MHz right side: 1294 MHz |
 |
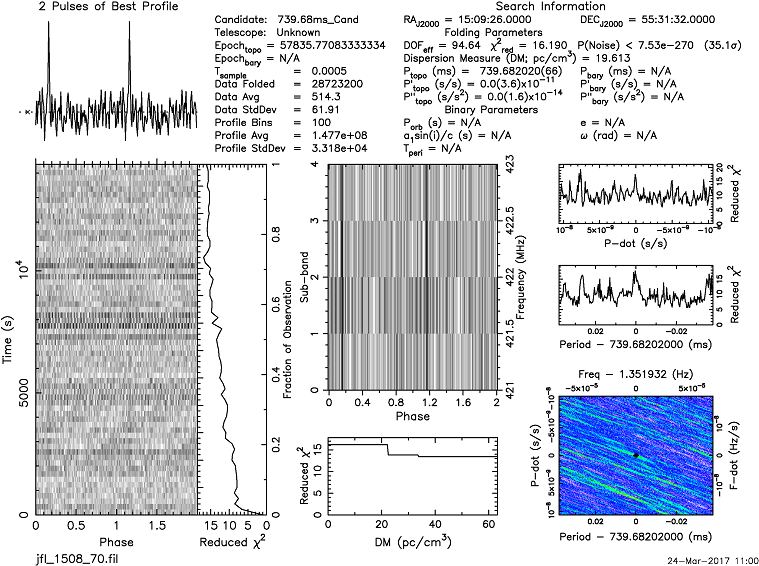 |
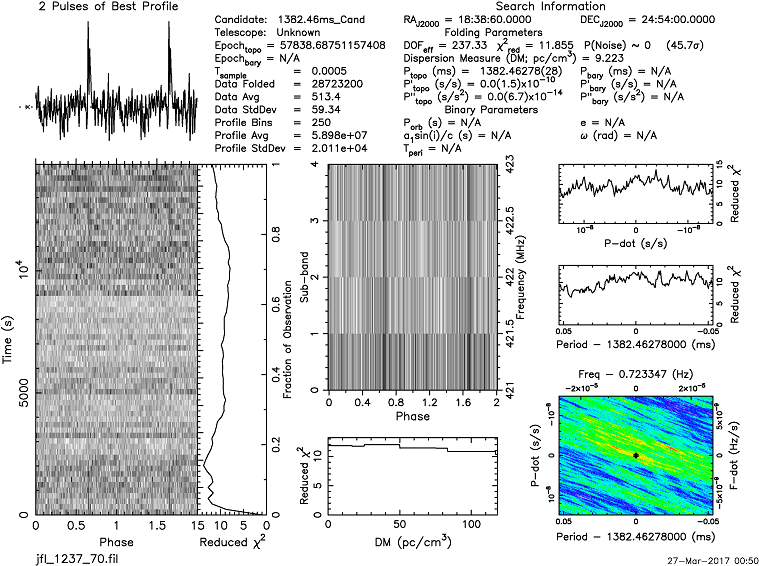
 left
side: 424
MHz,
S/N=26
right side: 1294 MHz, S/N=9
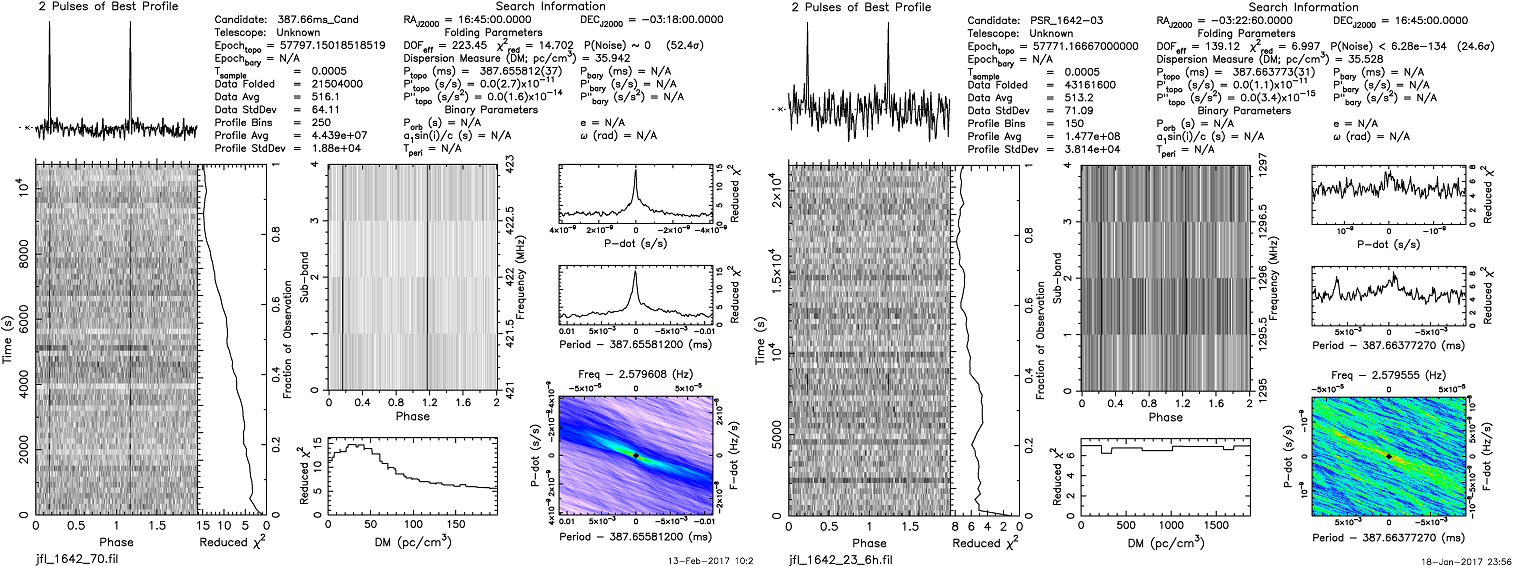
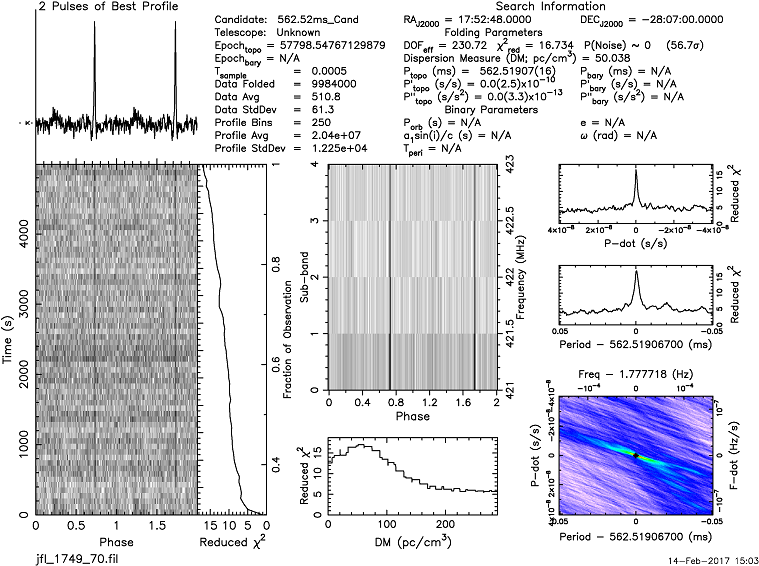
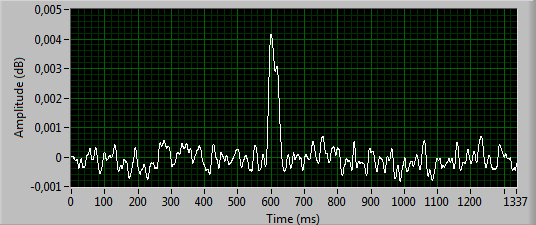
Using my new system (Airspy SDR with 10 MHz bandwidth), I made drift scans on 41 consecutive days, each 30 minutes duration. B1642-03 drift scans |
 |
|
| left side: 424 MHz right side: 1294 MHz |
|
|
 |
|
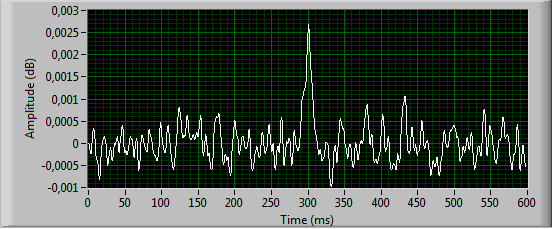 424 MHz, S/N=8 |
 |
|
 |
 |
 |
|
 |
 |
|
|
|
 |
|
|
|
left side: 424 MHz right side: 1294 MHz |
|
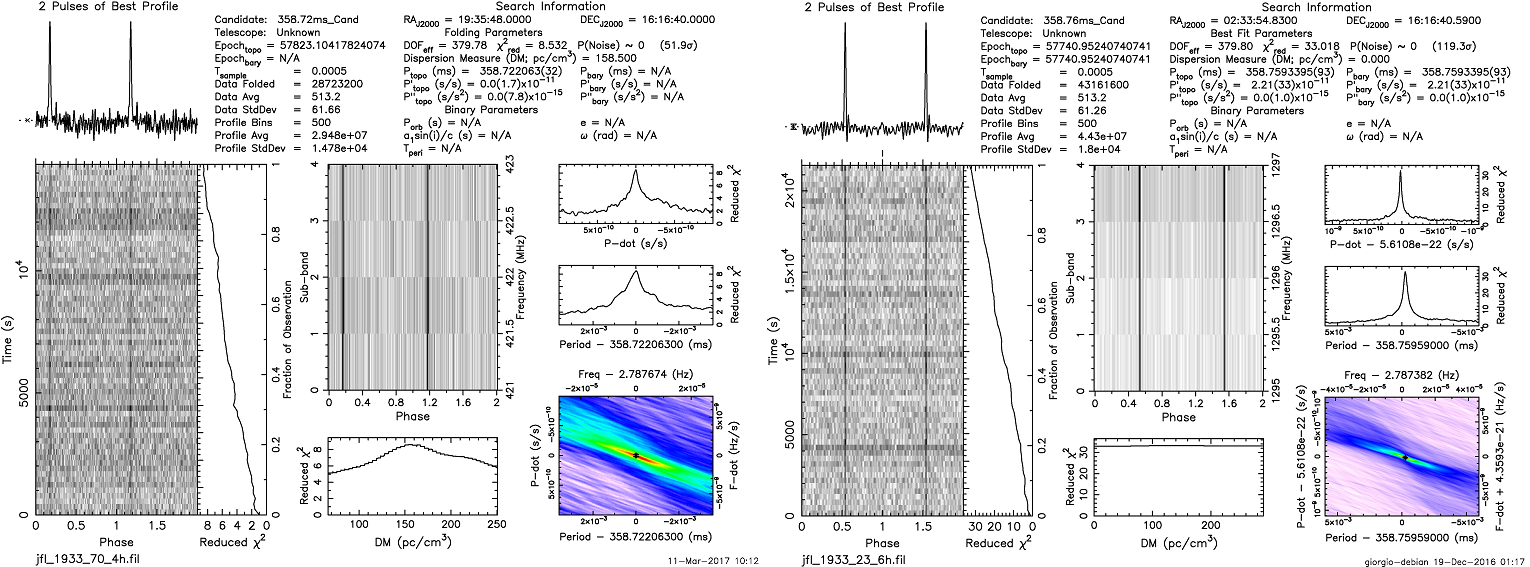
left side:
424 MHz,
S/N=20
right side: 1294 MHz, S/N=31 |
 |
 |
|
|
This
pulsar has a very high
dispersion, making things difficult on 424 MHz. The channels are
separated by slightly more than 8ms to each other, this is nearly as
much as the pulse width itself! If you look carefully, the dispersion can be even seen on 23cm, but it is only in the range of 1ms over all channels. |
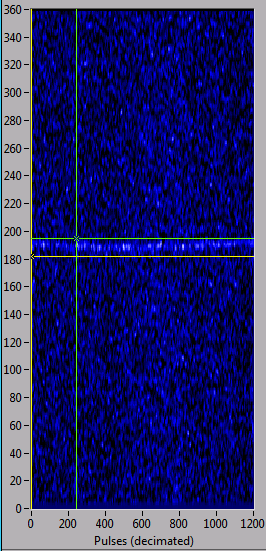
The waterfall graph of a 6
hours reception of the B1933+16 pulsar on 1294 MHz shows that the
frequency is not constant
over this long period. This can result in a lower S/N
when making long time observations without using special software. |
left side: 424 MHz, S/N=20 right side: 1294 MHz, S/N=31 |
 |
|
|
 |
|
|
|
left side: 424 MHz right side: 1294 MHz |
|
|
|
|
| left side: 424 MHz right side: 1294 MHz |
|
|
|
|
| left side: 424 MHz right side: 1294 MHz |
 |
 |
|
|
 |
|
|
|
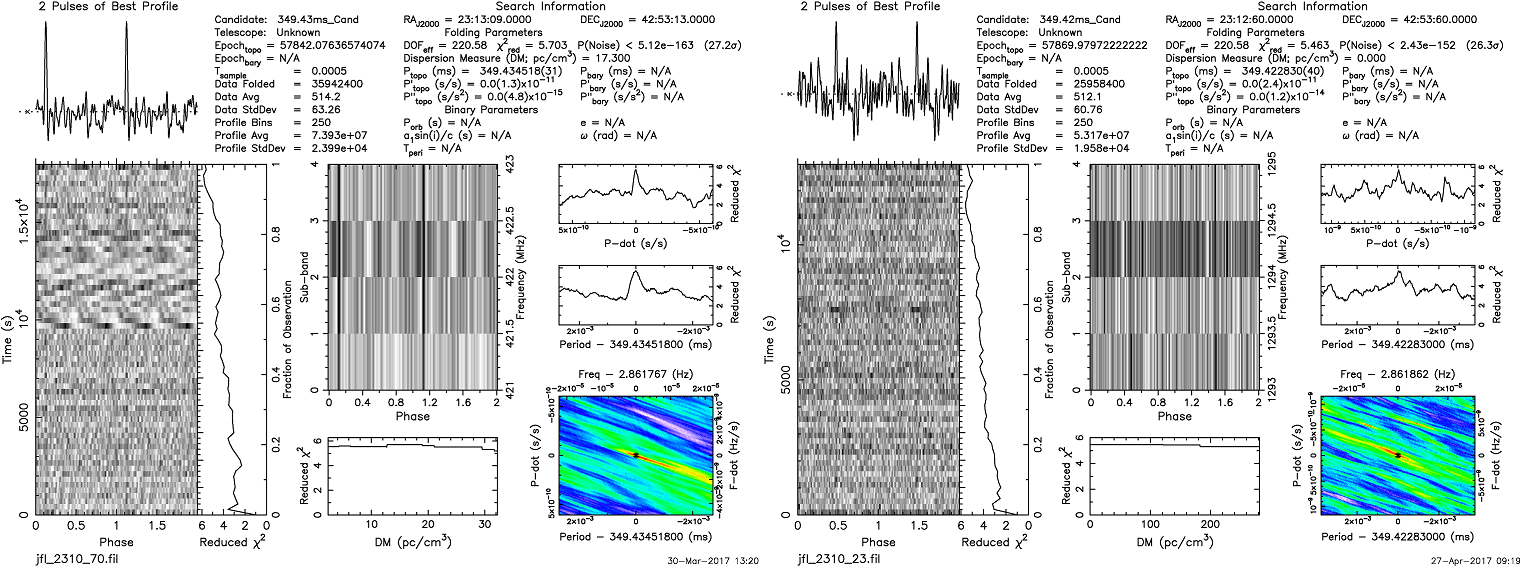
left side: 424 MHz right side: 1294 MHz |
