Hugo sees ghosts
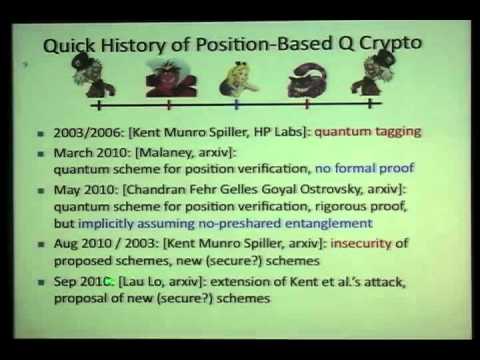
Fri, Sep 21, 2018Christian Schaffner is at his best when telling a personal story: His quest to verify the position of someone leads him from the moon-landing to the spooky quantum world. But, he ends up with a no-go.
Christian concludes: “no one can verify my exact position” - so sad.
It is normal to see things that no-one else can verify… Yes, we can see ghosts and ufo’s at halloween.
Ghost imaging
Ghosts imaging is a technique to send and receive pictures without additional logic ; Raster-based television, like slow-scan-television (SSTV) uses a scanning beams and pixels, … but ghost imaging can be decoded with the human eye.
- Based on the paper: “ Ghost imaging with the human eye” (Alessandro Boccolini Alessandro Fedrizzi and Daniele Faccio).
Overlay a source image with a sequence of patterns (X_i) and observe the total amount of the reflected light (o_i). This is, in math, the equation:
r = X o for i: 1…n
- X an n² x n² matrix of patterns
- X_i a flattened pattern (size n²):
- o an n² vector of observations
- o_i a observation (scalar)
- r is a n² vector with the (flat) image to be recovered (unknown):
Example
The original image (64.png)


Overlay patterns using the hadamard function

Some observations…


Image reconstruction using solve
After n² observations, the image can be reconstructed:

Ghost imaging in R
library(pracma)

library(raster)

require(gtools)


toghost <- function(h,s ) {

  m <- raster( h ,xmx=64,ymx=64  )

  mm <- resample( m,s, method='bilinear')

  mm[mm >0 ] <- NA

  ma <- mask(s,mm)

  ma[ma <=0 ] <- 0

  aa <- cellStats(ma, mean)

  #plot(ma,main=paste('overlayed image, reflection observed: ', aa ))


  return( aa )

}


s<- raster( "64.png",band=1 )

s[] <- (s[]/255 - 0.5)*2   # hadamard values: [-1 .. 1]

hn = 32    #  resolution, use 16 for lower  resolution but faster

h <-  hadamard(hn)


pr = sample( hn )

pc = sample( hn )

hshuffle = h[pr,pc]

a <- toghost(hshuffle,o )


o <- c(a)

X <- matrix()

X <- rbind( as.numeric( as.list(hshuffle) ))


for (i in 1:((hn**2)-1)) {

  pr = sample( hn )

  pc = sample( hn )

  hshuffle = h[pr,pc]

  a <- toghost(hshuffle,s )

  o <- c(o, a)


  X <- rbind(X,  as.numeric( as.list(hshuffle) ))

}


b = solve(X,o)

re <- matrix(b, nrow=hn)

plot(raster(re))