FT-2000/SP-2000
Audio Spectrum Plots - July 25, 2010 - W6CP
FT-2000 Serial Number 7L260010 (mfg October, 2007, run 26)
These plots were made by connecting the SP-2000 headphone jack to the
computer line input, so we see directly what is fed to the speaker. The
sound card is a Creative "Sound Blaster Live!
24-Bit" The measurements were made using baudline (a powerful
audio analyzer for Linux, Mac, and other Unix systems).
For all measurements the sample rate is 24 ks/s with no decimation, the
transform size is 2048 with a Kaiser window with ß=25. Someone
who
understands this stuff better then me could calculate the effective
noise bandwidth of the measurement, but I'd guess it's in the vicinity
of 10 Hz. The display is a continuous average with a 10 second
duration. This reduces the noise to an average value nicely. These
settings produce a plot with a frequency range of 0 - 10 kHz which
shows not only the range that we want to hear, but also the wideband
noise which is perceived as hiss. Also note that the plot shows a
dynamic range of over 130 dB, but the accuracy is questionable below
about -100 dB.
For all plots the mode is set to CW, and the radio bandwidth is 2.4
kHz. The radio is tuned to the vicinity of 14080 kHz. The filter
switches on the SP-2000 are set to the widest settings. My notes are
below each plot.
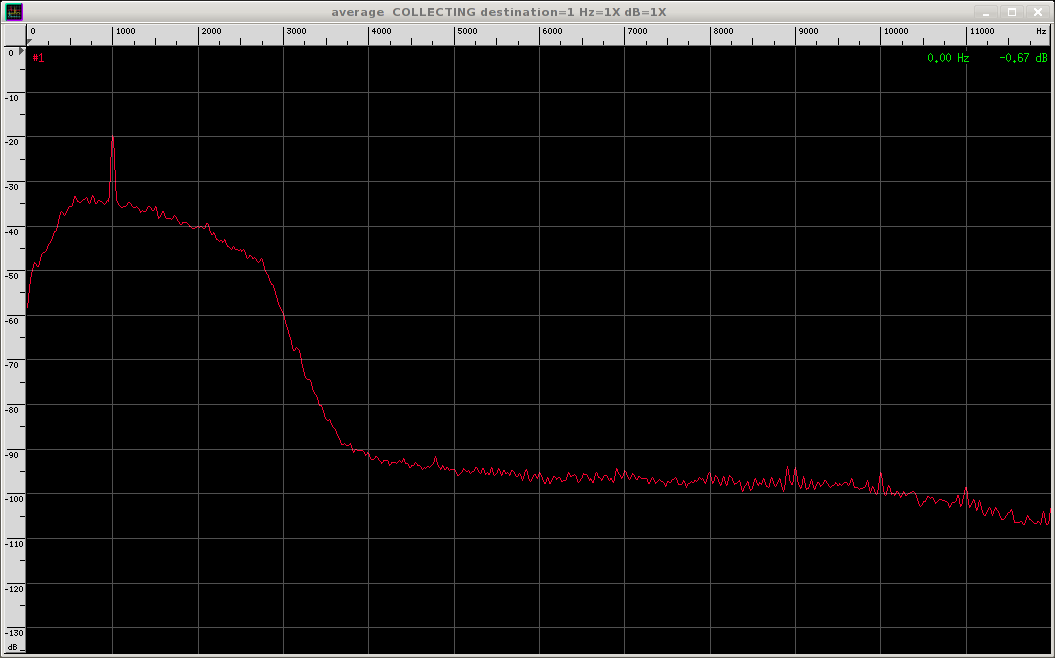
Plot 1
The first plot is with an antenna connected, the RF gain at max, and
the AF gain set to 11 o'clock. There is an S-2 signal at 1 kHz. Note
that the atmospheric noise which passes through the IF filter (2.4 kHz)
produces a very large rise over the broadband noise of 50-60 dB. Also
note the slope to the noise inside the filter bandwidth of something
like -6dB/octave. This slope is completely absent when the audio output
is taken from the "Packet" jack on the back of the radio.
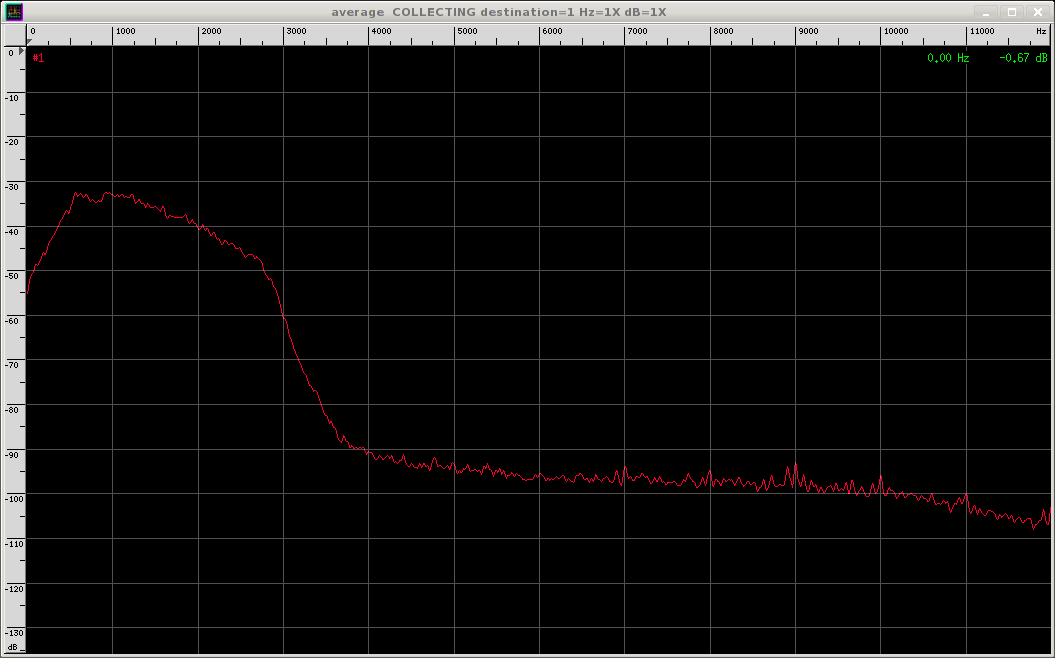
Plot 2
This plot is with the same conditions as Plot 1 except there is no
signal present. The power inside the IF bandwidth is slightly higher as
the AGC has increased the gain.
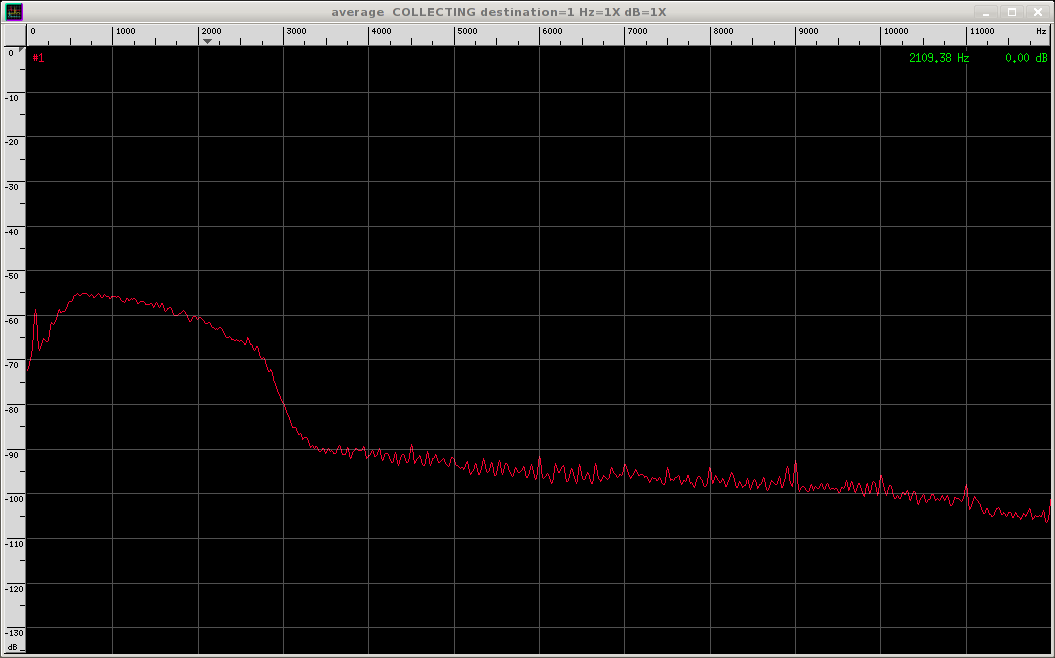
Plot 3
This is the same as Plot 2 but with the antenna disconnected. This
shows that the front-end gain is sufficient to cause the front-end
noise to dominate the wideband noise produced later in the receiver (as
it is an any well designed receiver). In
this case the front-end noise is 30-40 dB greater than the wideband
noise (measured in the same bandwidth). Note the appearance of a spike
at somewhere around 90 Hz. This is apparently a spur generated in the
sound card since it's frequency changes with the sample rate.
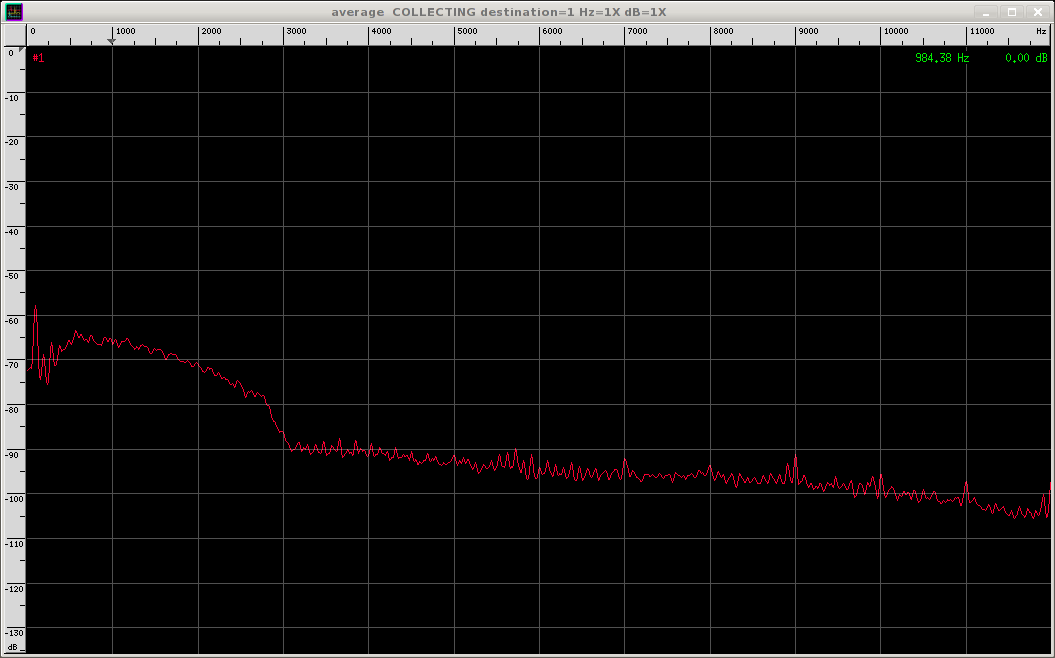
Plot 4
This is the same as Plot 3 except that the AF Gain has been reduced
from 11 o'clock to 9 o'clock. Note that the noise in the IF passband
has dropped about 10 dB, while the broadband noise above about 3 kHz
has not changed.
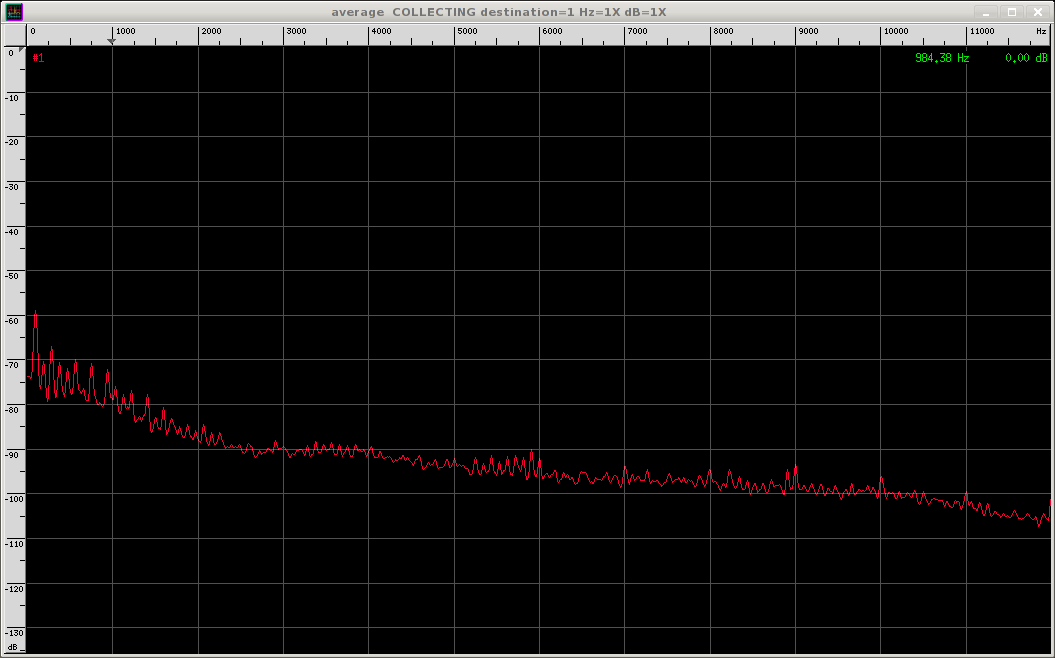
Plot 5
Here the Audio Gain has been reduced to just enough to cause the output
relay to turn on. Just a slight increase from here causes the front end
noise to pop up out of the noise. Interestingly,
the broadband noise above about 3500 Hz is exactly the same indicating
that it's
source is after the AF Gain control. Note that the noise below 3 kHz
has roughly the same slope as the noise through the IF filter.
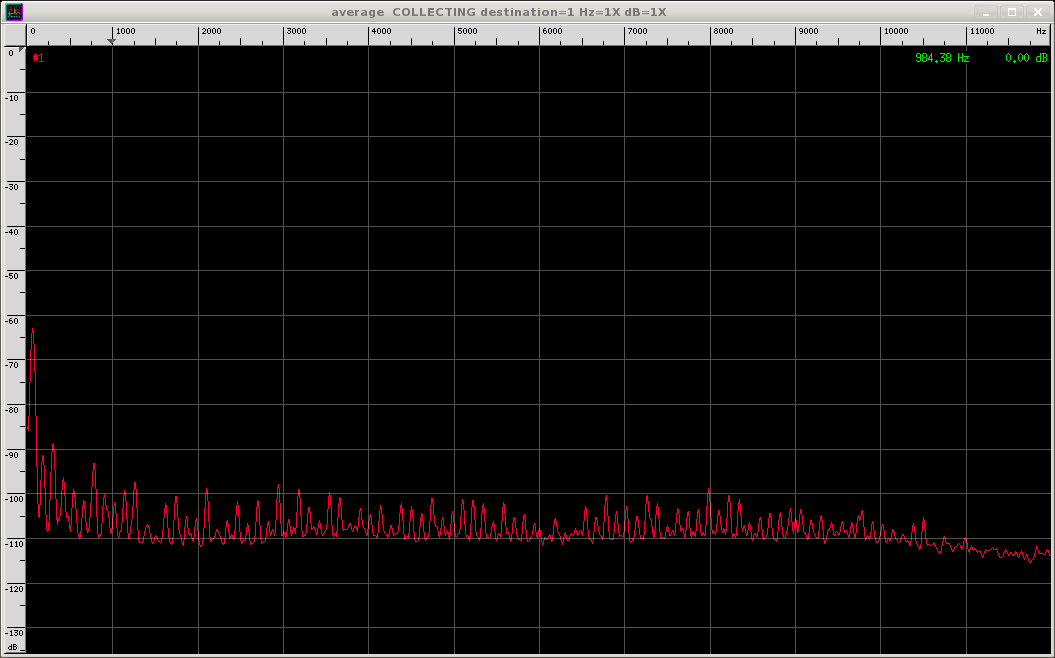
Plot 6
This is with the AF Gain set to minimum and the output relay has
dropped out. The 90 Hz spike is gone but a 60 Hz spike has appeared.
Except for a few harmonics of 60 Hz, everything is below about -100 dB.


