PN2060C/DV2 Phase
Noise Analyzer
Summary
The PN2060C Phase Noise Analyzer measures the amplitude, phase noise of high-performance RF sources.
Features
Independent input and reference frequencies from 1 to 200MHz
No phase-locking or measurement calibration required
Dual reference oscillator inputs allow cross-correlation measurements
USB3.0 interface with high-speed data exchange
Allan deviation: two channel cross-correlation supported (<3e-15@1s typical value)
Phase noise: <150dBc/Hz@1Hz, <-130dBc/[email protected] (pn2060 v7.54)
Measurements
Phase noise at offsets from 0.001Hz to 8MHz (v2) and levels below -180dBc/Hz (10MHz floor)
One high quality USB3.0 cable is enough to complete data collection and power supply
System Noise Floor Specification:
|
Offset |
10MHz carrier (90minutes) |
|
0.1Hz |
-130 |
|
1Hz |
-150 |
|
10Hz |
-160 |
|
100Hz |
-165 |
|
1KHz |
-175 |
|
10KHz |
-180 |
|
>100KHz |
-180 |
Electrical Specifications: Input Signal Level: 10dBm (max), Input Impedance: 50
Mechanical Specifications
Size: 11 x 10 x 4 (cm), Power: USB3.0 power supply with about 1.1A. Operating Temperature: 0-35deg
Unit Weight: 0.5kg.
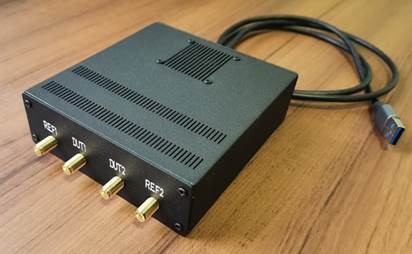
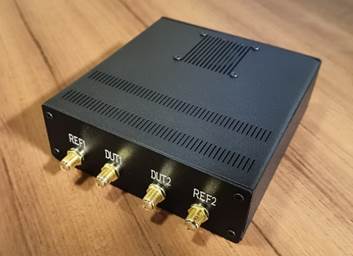
Front Panel: SMA RF connector ( DUT1, DUT2, REF1, REF2)
Real Panel: Type-C ( USB3.0 to Type-C cable needed)
Software: 1) WIN7/WIN10/WIN11 64bit supported (test setup, real-time update of phase noise, and collect raw data), scripts for post-process.
Driver: USB3.0 interface
Typical measurement examples:
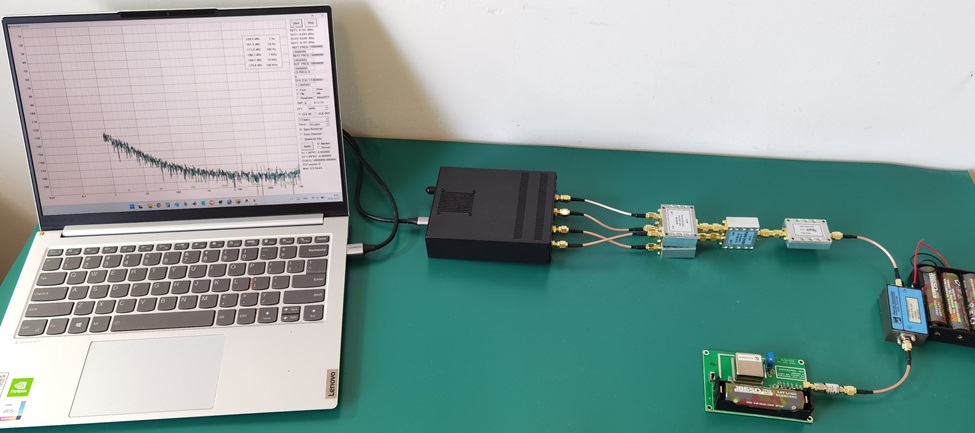
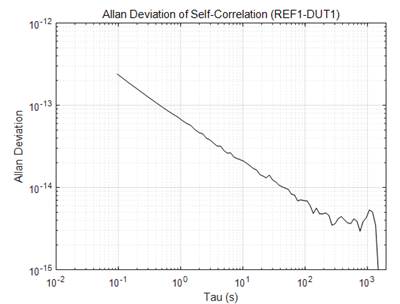
1) Self-Correlation Noise Floor:
Utilizing a 10 MHz CTI OCXO with 9dBm, and feed to REF1, REF2, DUT1, DUT2 through a 4-way power splitter. Then there is only about 2dBm at each channel. The performance can be improved if feed the 4 ports with 10dBm through an AMP. PN2060 v7.58 is the new software.

Note:
i)
Notches in the
measurement. Samuel R. Stein [15] has detailed
descriptions (solutions) about them*.
ii)
An issue in the
self-correlation process was identified by Visme (PhD
student) at the FEMTO-ST Institute [17], where the noise floor exhibited
abnormal behavior when the frequency deviation was less than approximately 1
Hz. For the PN2060C analyzer, <-150dBc/Hz
@1Hz was guaranteed. Meanwhile, Pomponio at NIST [18] demonstrated
that, with a carefully optimized setup, a digital PNA can achieve phase noise
levels below −160 dBc/Hz @1Hz, with a measurement
time of approximately two days. The principle and algorithm of the digital phase noise analyzer is
detailed described in literature about 20 years ago [10]. It
is demonstrated by sm5bsz that -133dBc/Hz @ 1Hz is reachable for a 10M OCXO.
iii)
Carefully configure the self-correlation setup, as failure to follow the guidelines
will lead to various unexpected issues.
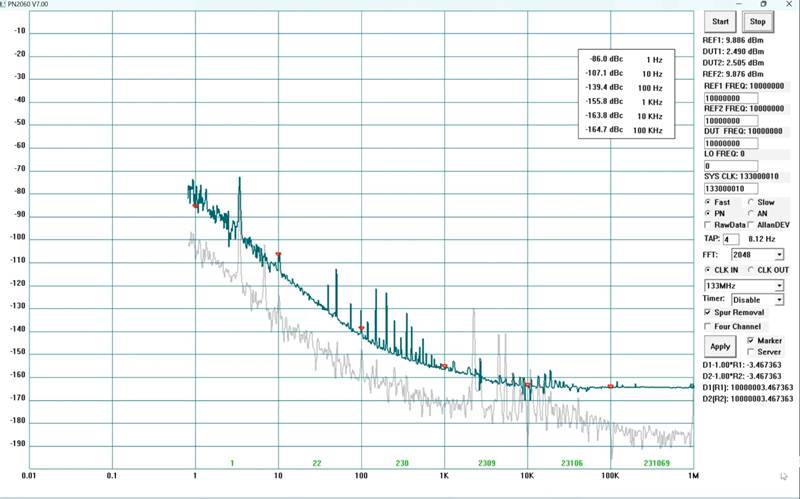
2) PN2060C vs Agilent E5052: Measurement
of a 49.152MHz XO (link)
SCTF LN 49.152M XO: CMOS output, 11dBm, square wave. When measuring such XOs, a filter is necessary to prevent harmonics from affecting the measurement results. To address impedance mismatch, insert an attenuator in series.
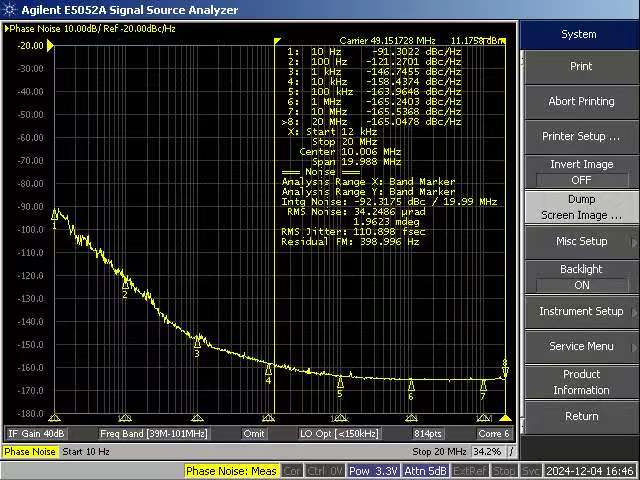
Critical Capacitors: One capacitor (2.2uF) should be placed as close as possible to the XO, while another capacitor is used to isolate the DC from the output pin. Without these capacitors, the measurement result will be significantly degraded. This may explain the design of some Crystek��s XOs.
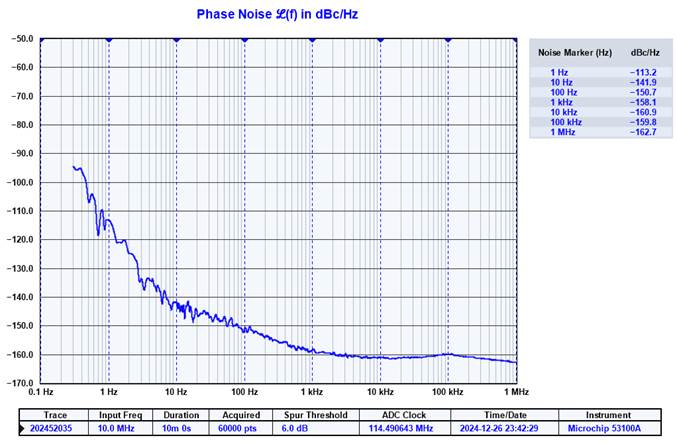
3) Comparative test on a
batch of 10 MHz oscillators using PN2060C and 53100A
All the tests were completed at a crystal workshop within a short timeframe, ranging from 3 to 9 minutes for the PN2060C, and 10 minutes for the 53100A. One of the test results is shown in the following plot.
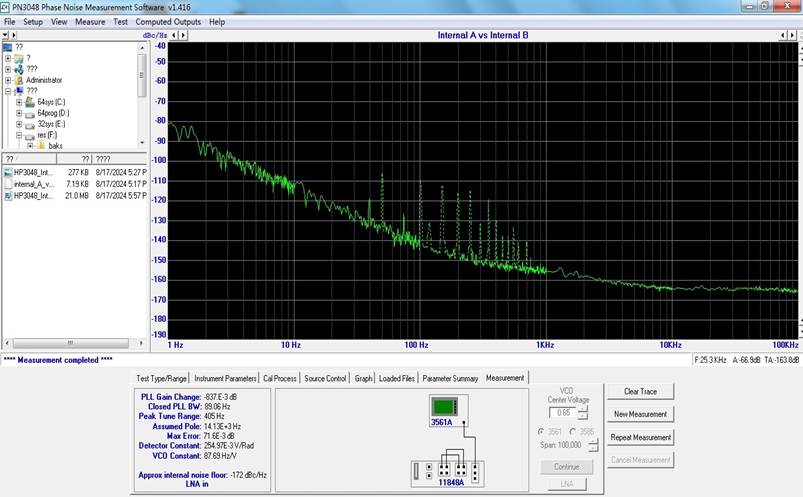
4) PN2060C vs HP3048A: Internal A
(10MHz) vs Internal B (10MHz) (link)
The internal A (10MHz) and internal B (10MHz) of HP3048 are phase-locked with each-other in this measurement. In the measurement with PN2060C, it is in an open-loop configuration, and there is a spur at about 3.5Hz which is the frequency difference of internal A and B.
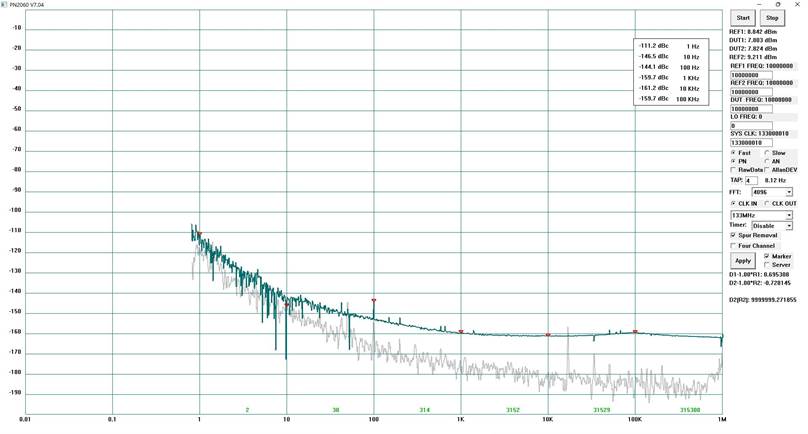
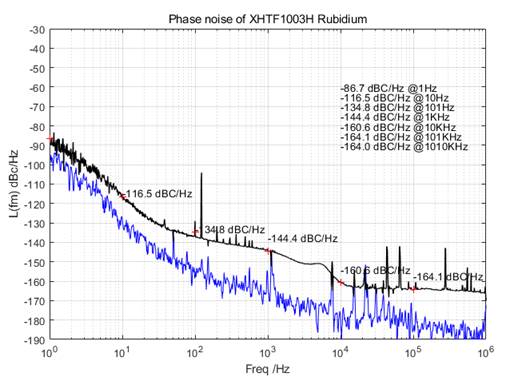
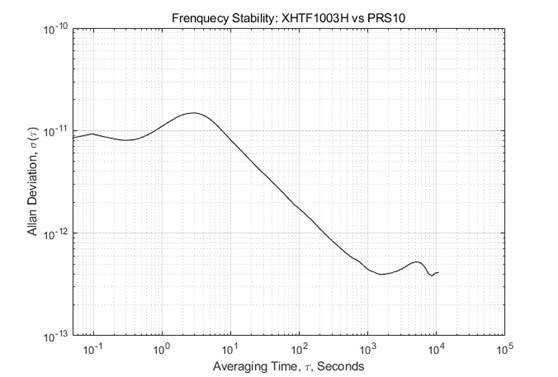
5) Measurement of Rubidium Frequency Standards: XHTF1003H vs PRS10
The XHTF1003H has a better performance (<100s). HP5071A is necessary (as References) for a accuracy measurement result.
Notes & Warnings:
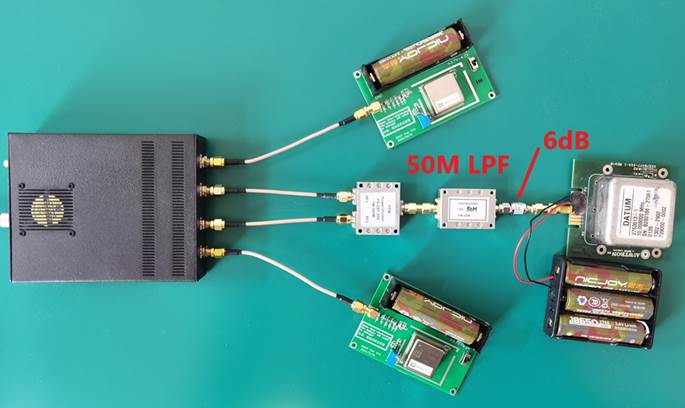
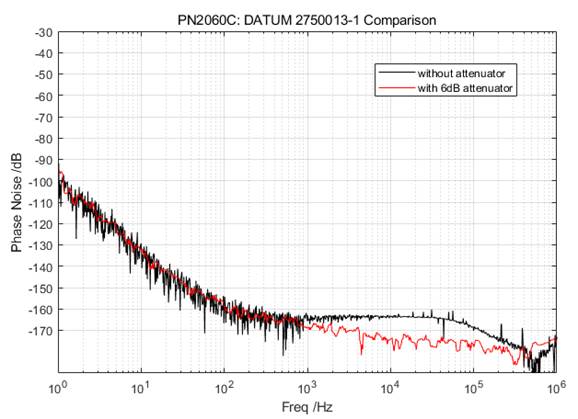
1) As a digital phase noise analyzer, artifacts can be occurred according to [1, detail]. All the phenomenon reported in [1] can be reproduced with some specific power splitters (3dB/6dB/10dB/active) & filters & attenuators & specific OCXOs. Strange behaviors will be resulted from impedance mismatch & poor isolation & aliasing frequencies. Solution: Series an attenuator, such as 6dB to improve impedance mismatch, and mini-circuits SLP-50+ (Nyquist Filter) can be used to remove aliasing frequencies. Isolation AMPs should be adopted for some OCXOs with poor isolation.
2) Some OCXOs have poor isolation, such as part of the old DATUM 2750013-1 models (not all of them). This can result in significant deviations during measurement. Therefore, the use of isolation amplifiers or attenuators is essential for accurate results. Following is a comparison with/without 6dB attenuator.
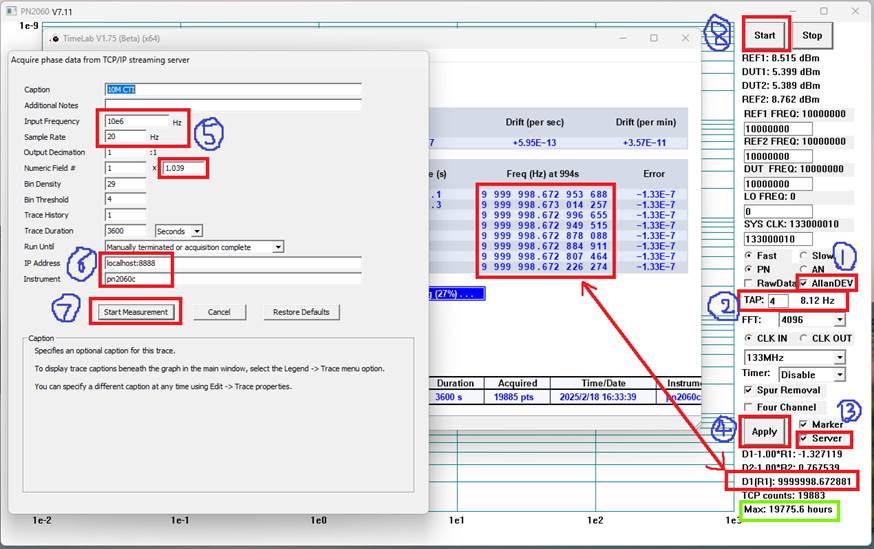
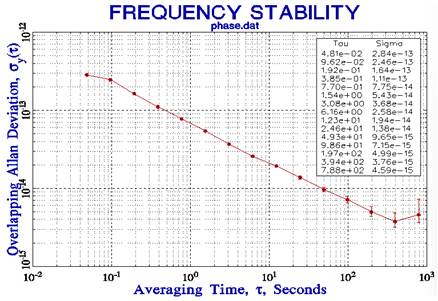
6) External clock can be supported in an elegant way without any modification. The TCPServer (localhost:8888) function can send data stream to other applications (Example setup: AllanDEV, tap: 4, sample rate: 20.78 sps (Fast) or 10.39 sps (Slow), data stream: phase difference of DUT1 to REF1, Scale Factor: 20.78/20=1.039).
Notice:
1) Data streams sent to other applications were
improperly truncated in previous versions. Thanks Leif (SM5BSZ) for his
thorough and detailed feedback.
2) If you change the TAP (ENBW) value, the sampling rate
will be truncated, for example, if TAP=5, the sampling rate will be 2 (NOT work
with 2.078), which will raise calculation error. Scale Factor (1.039) should be
entered to correct it.
3) Software version before V7.11 has critical
error for a long time running for Allan Deviation.
4) The ��Max��
indication: depending on the ��TAP��
value and RAM size, the max available running time (theoretically) for Allan
measurement.
To calculate the sample rate, note that the baseband
signal��s rate is f_ADC/64 in fast mode (yielding
2,078,125 SPS) or f_ADC/128 in slow mode (yielding
1,039,062.5 SPS). With TAP set to 5, the signal is further decimated by
10^(1+TAP), which equals 1,000,000. Therefore, the final sample rate is
2.078125 SPS in fast mode or 1.0390625 SPS in slow mode.
Warning (know issues):
1)
The phase difference of REF1-DUT1 (or REF2-DUT2) in the time domain has
not been optimized by the filter, and there is a ringing phenomenon;
2)
The phase difference will drift randomly. This issue is currently under
investigation, and the following is an example of the phase drift observed in
the self-correlation process. The raw data is also fed into stable32 [20] for
further comparison.
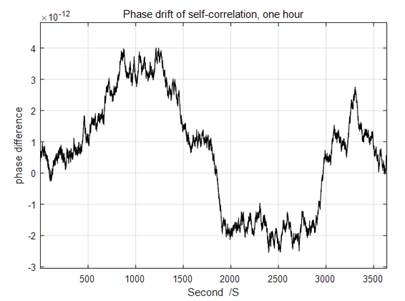
These issues were fixed with PN2060 v7.58.
The Device works as a Frequency Counter: The REF1 channel works as a reference, i.e., always assume the real frequency of the REF1 is equal to its nominal value. Then, the frequency of the DUT will be calculated accordingly.
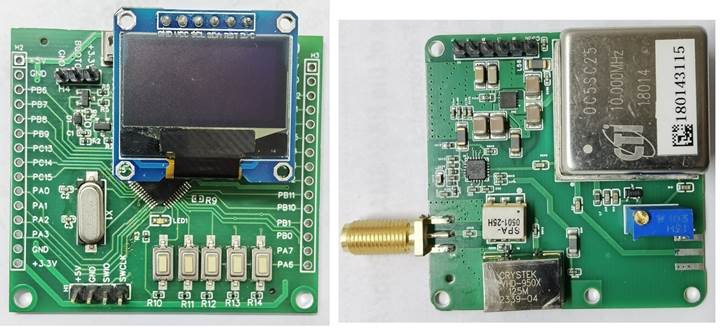
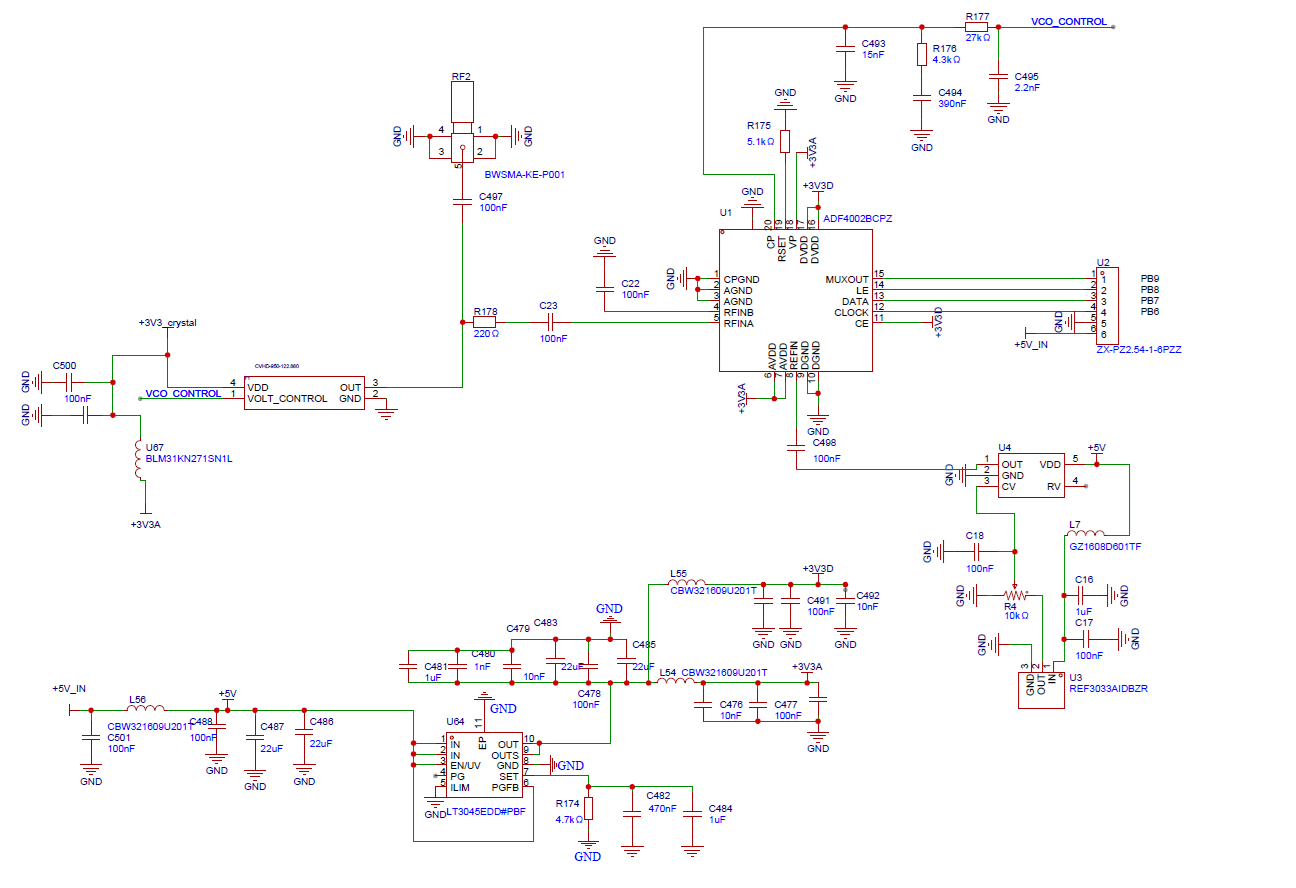
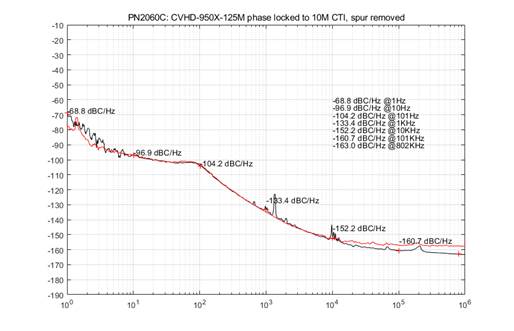
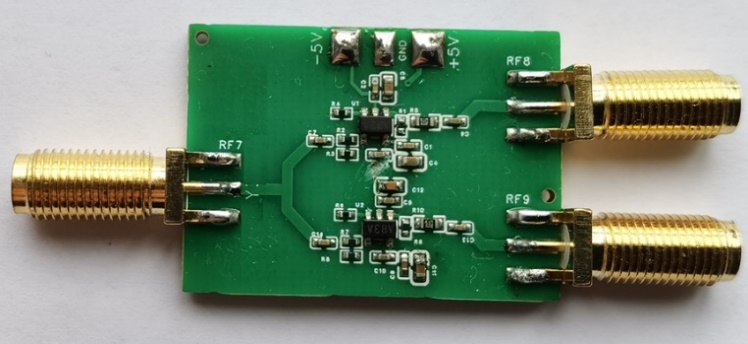
7) Phase-locked Module Design
A phase-locked module is designed, where a CVHD-950X-125 is phase-locked to an old OCXO (CTI 10MHz). It can also be locked to any other VCXOs (<400MHz). This module can also be used as an external clock for the device. Note: A bandpass filter (e.g., 80M-140M) should be connected in series to filter the signal during this measurement.
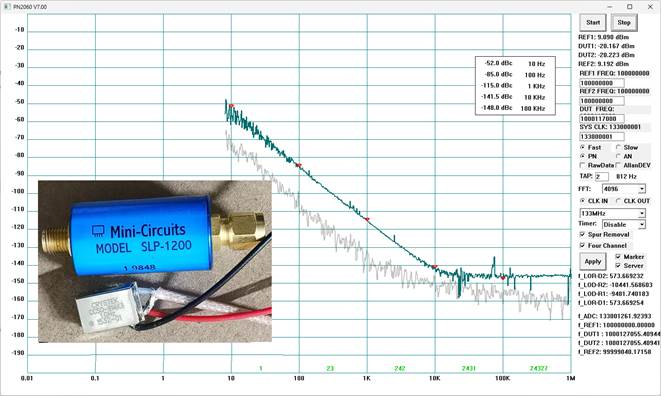
8) Extreme Test: Direct measurement of a 1GHz DRO
A CCSO-914X3-1000 (CCSO-914X-1000 with a better performance) is measured directly (with a mini-circuits SLP-1200). The input signal is attenuated about 25dB by the front-end of the device in this scenario. CVCSO-914-1000 is another variant, which is a voltage-controlled version.
Notes:
The best performance can be achieved in the First Nyquist Zone (1MHz-67.5MHz). At the second Nyquist Zone (67.5MHz-133MHz) and beyond, the measurement ability of the PN2060C will be degenerated gradually. Extremely, at 1GHz, the measurement only accurate within about 10KHz deviation (Filter should be adopted, otherwise, aliasing frequencies will contaminate the measurement result).
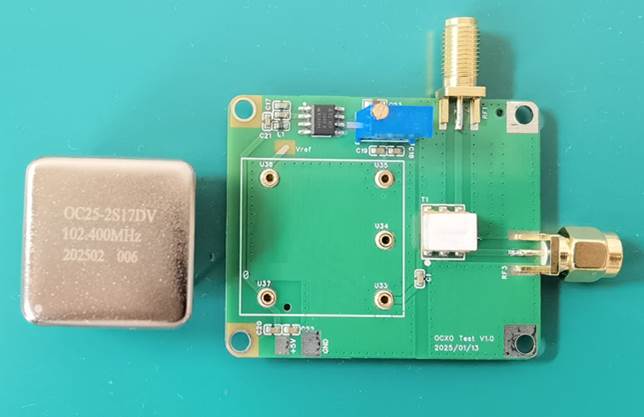
9)
Measurement of a 100M OCXO (2nd Nyquist Zone)
Band Pass Filter should be adopted beyond the 1st Nyquist zone for a better performance when measuring the DUT directly. For laptops, DO NOT using external power supply, using its battery instead. The noise floor will be affected.

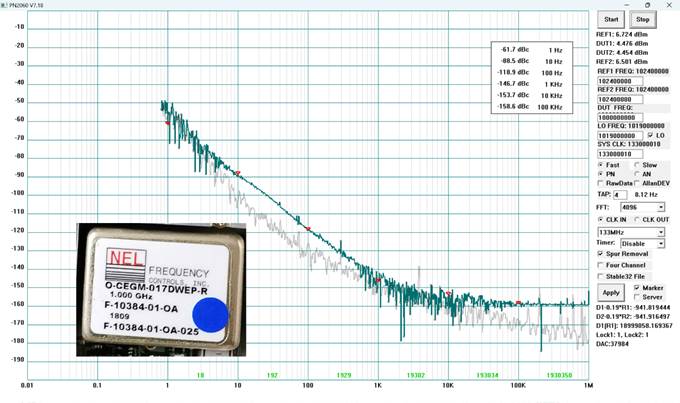
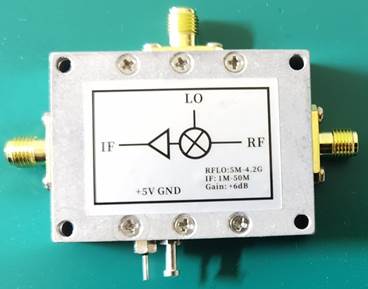
10) PN2060DV2��PN2060C
with Down-Converters (Link)
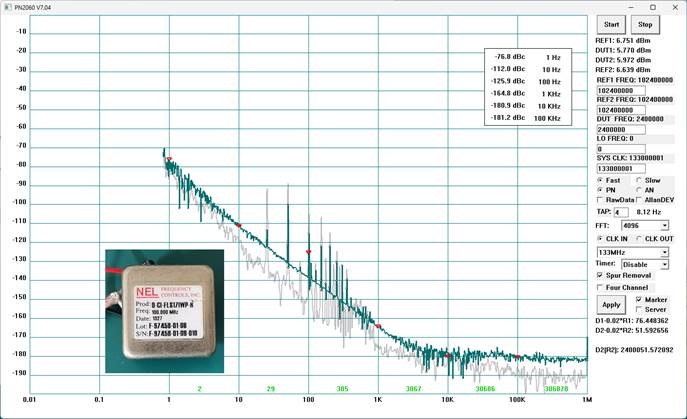
As the best performance is achieved in the first Nyquist Zone (1MHz-67.5MHz), down-converters are highly recommended beyond the first Nyquist Zone. The PN2060D is engineered with all components seamlessly integrated into a single compact enclosure, delivering continuous coverage across a frequency range of 50 MHz to 7 GHz. For instance, an OCXO from NEL��widely recognized as one of the finest 1G OCXOs available��has been evaluated to demonstrate its exceptional performance. An example: Measurement of a 3.8G DRO.


11) HP8664A Phase Noise Measurement
HP8664A is a canonical low phase noise signal generator. Following is the phase noise measurement of this unit (with option 004). The measurement results match the specification quiet well although this unit is nearly scrapped (>25 years old).
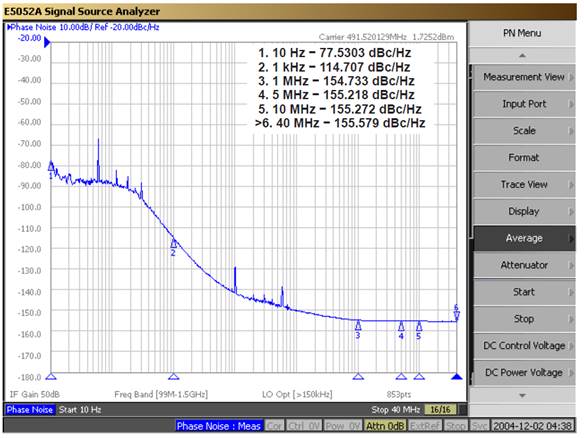
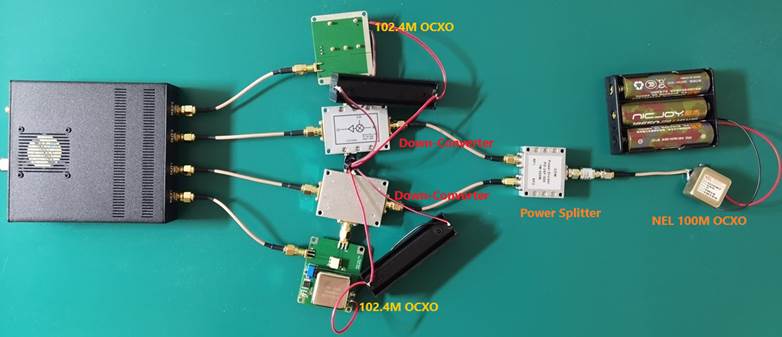
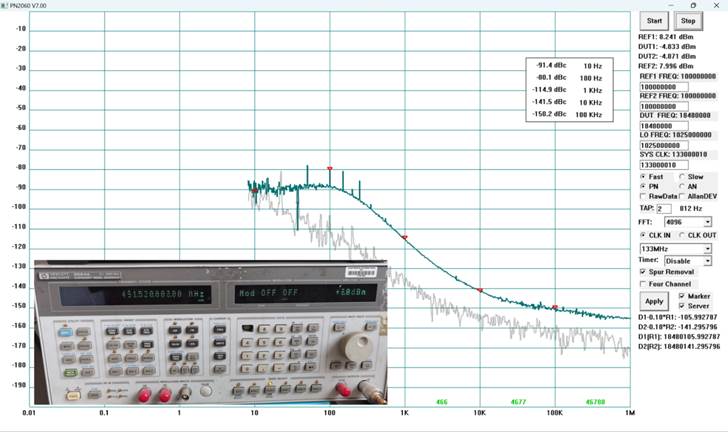
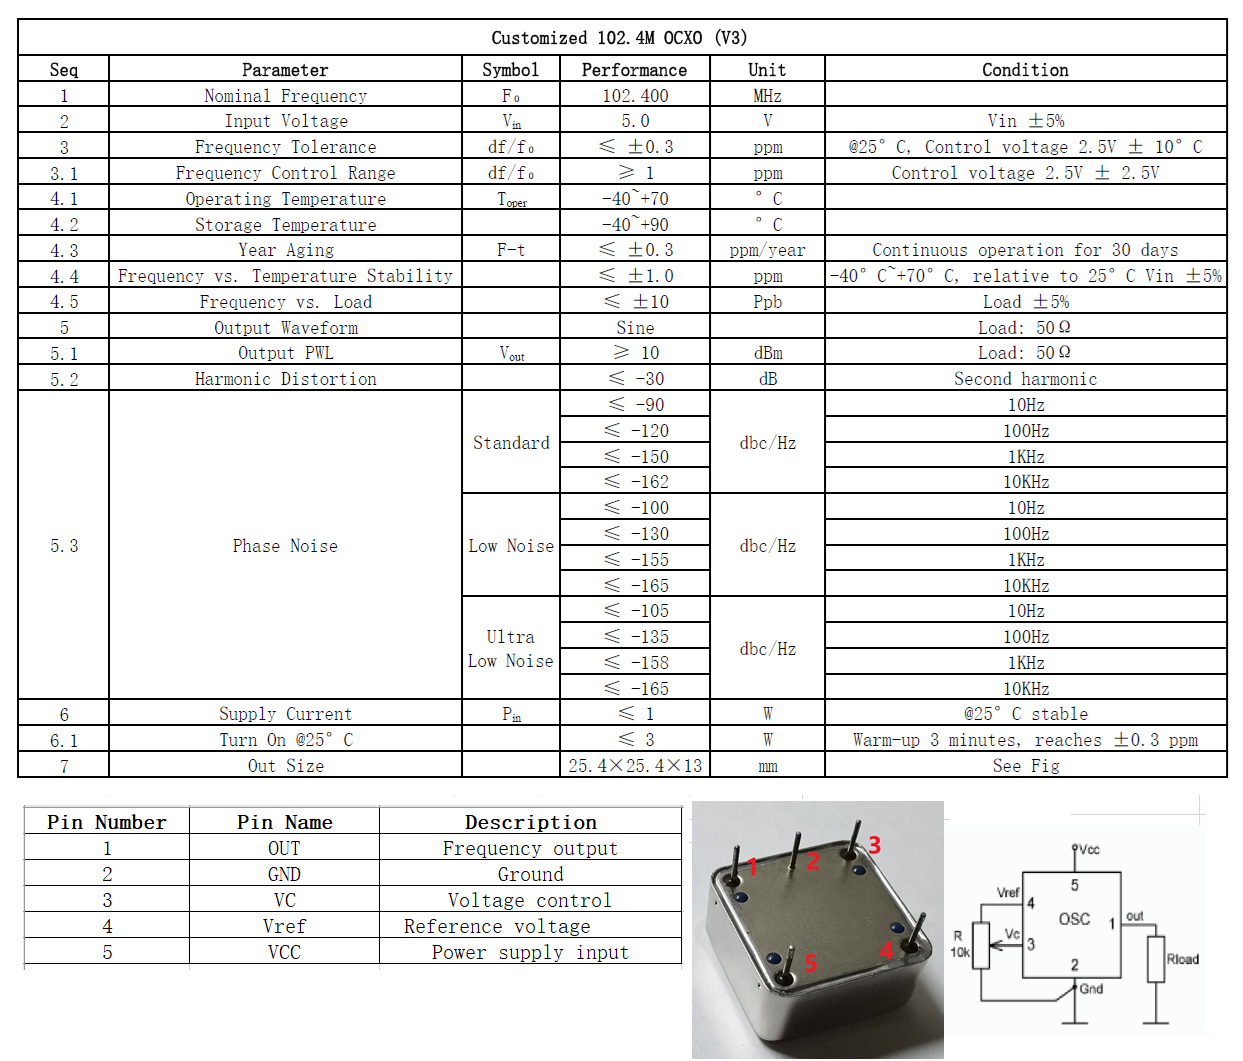
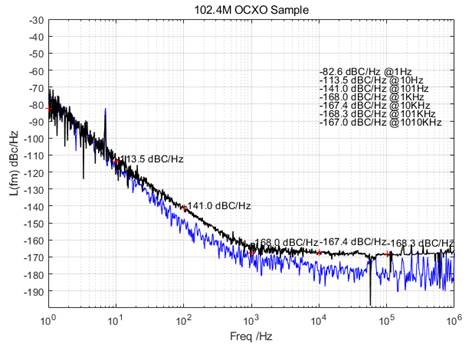
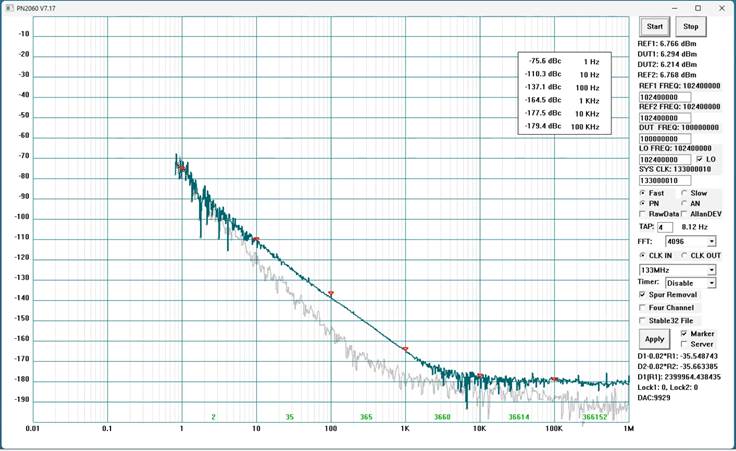
12) New Design
In this design, 102.4MHz OCXOs (V3) (Video) are utilized to measure a 100MHz NEL OCXO (some comparisons in [19], and thanks to Roman, the author of [19], for confirming the measurement results). So, the 2nd Nyquist Zone (50M-150M) can be down-converted to the 1st Nyquist Zone. The issues (aliasing frequencies & impedance mismatch & isolation & ADC jitter) can be greatly relieved. Artifacts are much less occurred when down-converted to the 1st Nyquist Zone. Spur-free is achieved automatically with new design.
Notes for this measurement:
1) Laptops using batteries instead of external power supply can achieve a better result than PCs, especially when the noise floor of a DUT goes below to -180dBc/Hz.
2) When go below to <-180dBc, the electromagnetic environment became sensitive (including nearby FM/TV stations in your local region), change a measurement place (for example, another room) if necessary.
3) The cable from the DUT to the device is very important. Make sure using cables with good shielding and as short as possible.
4��Critical Capacitors: One capacitor (100nF-2.2uF) should be placed as close as possible to the OCXO.
13) SRD frequency multiplier module
An SRD multiplier module was developed, and the phase noise at 1 GHz and 3.5 GHz was measured using appropriate band-pass filtering. The module was driven by a customized 100 MHz OCXO with a typical noise floor of approximately −169dBc/Hz.
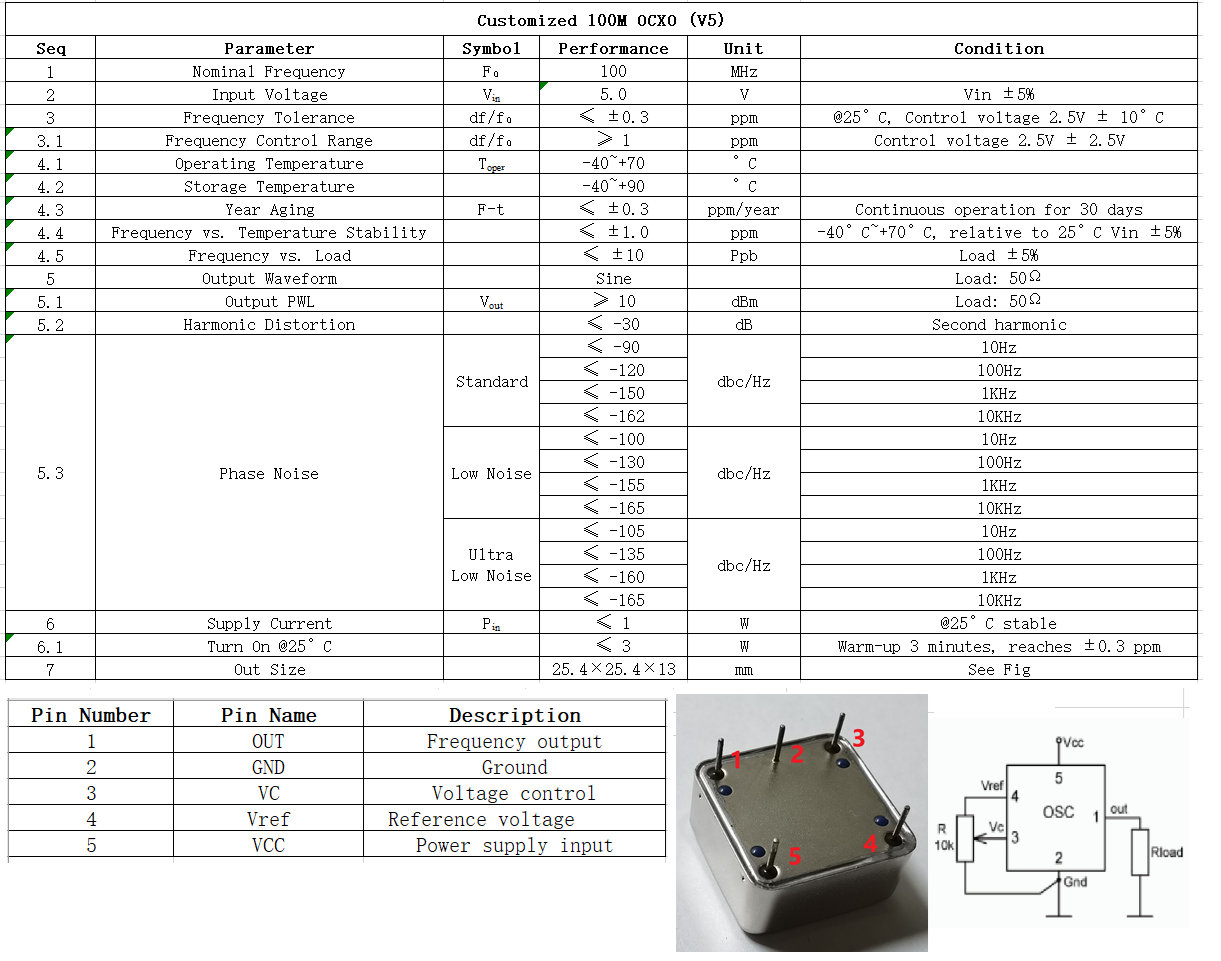
14) New application is
under development, and all processing steps will be rewritten from scratch
based on this initial DEMO version. Measurement Demo for a
customized 100M OCXO.

Ordering Information:
Attentions:
1)The current is about 1.1-1.5A totally, which can vary with the frequency of the system��s clock. The USB3.0 of some PCs can not provide such a high current while some of them work normally. Some USB3.0 cards can be helpful. The following types of USB3.0 cards have been fully tested and verified.
Update for some mainboards: the economical one (MSI H610 Series) cannot work properly, MSI B760M is verified and running without problems.


2) The device should be connected to the USB3.0 interface in the back-panel of a PC, not the one in the front panel. The USB3.0 in the front panel usually has a long line connected to the motherboard with exposed connectors, where additional noises may be introduced and the noise floor may be degenerated also.
3)The second-Nyquist zone and beyond: When diving into deep water area, all the phenomena reported in [1]-[3] can be encountered with different value of attenuators and with different bandwidth of filters. And aliasing may bring errors in noise floor measurements. An active power splitter is designed to perform some experiments. Test results shown that artifacts are more easily occurred with this active power-splitter.

4) Be careful of the phase difference between DUT1 & DUT2. According to [4], artifacts will be introduced with these differences. These kinds of artifacts are theoretically existed in the digital phase noise analyzer. FSWP utilizes another architecture which is trying to minimize them [5, p18].
5) Make a reliable connection between the type-C connector and the device. Always check the validity of the driver in ��device manager��. Try to make a 180-degree rotation if necessary.
6) The measurement result of the noise floor tends to be raised-up in second-Nyquist and beyond according to [14], dual-channel down-converter can be adopted to eliminate this effect.
7) According to [6], dual channel down-converter can be designed. A frequency divider with a very good performance [11] is available in literature, and it may be used in this architecture. VK4ZXI (Drew Wollin) managed to make a measurement with his own setup [13].
Acknowledgements:
I would like to thank for Andrew Holme. In the very beginning of the development of the PNA, I have learned a lot from Andrew��s wonderful work [7] and also asked for some helps. In the process of my design, I have gradually developed my own codes from PN2060A to PN2060C. But still use part of Andrew��s source codes in current release. Andrew has granted permission for me to use his source codes. I would thanks to Jim Henderson, Pual Hsieh, and Drew Wollin for their valuable feedbacks and discussions, where Jim Henderson implemented a mixer-based down-converter to extend the frequency range. Drew Wollin has written an introduction and review for beginners [8]. Pual Hsieh has some valuable discussions with me for potential improvement. I am also would like to thanks IW3AUT for the file converter tool which makes it compatible with other applications [9].
Further reading about phase noise
analyzer:
The principle and algorithm of the four-channel digital phase noise analyzer is detailed described in literature about 20 years ago [10]. Following figures [10] describe the detailed process of the four-channel. Firstly, the four channels are DDC (Digital Down Converted) to baseband (I,Q), and then, converted to amplitude and phase through a standard CORDIC algorithm. At last, all the data are uploaded to a PC, and processed according to these figures. There are a lot of such platforms available on market. I just build such a platform which I was preferred as no one such platform satisfy my requirement.


Rubiola��s phase noise website [12], where there are many important literature in this area, especially there are many new insights in their new book [16].
References:
[1] Y. Gruson, A. Rus, U. L. Rohde, A. Roth, and E. Rubiola, ��Artifacts and errors in cross-spectrum phase noise measurements,�� Metrologia, vol. 57, no. 5, pp. Art. no. 055 010 p. 1�C12, Oct. 2020, open access.
[2] Y. Gruson, V. Giordano, U. L. Rohde, A. K. Poddar and E. Rubiola, "Cross-spectrum PM noise measurement thermal energy and metamaterial filters", IEEE Trans. Ultrason. Ferroelectr. Freq. Control, vol. 64, no. 3, pp. 634-642, Mar. 2017.
[3] Nelson CW, Hati A, Howe DA. ��A collapse of the cross-spectral function in phase noise metrology��. Rev Sci Instrum. 2014 Feb;85(2):024705.
[4] Nelson, C.W., Hati, A. and Howe, D.A. (2013), Phase inversion and collapse of cross-spectral function. Electron. Lett., 49: 1640-1641. https://doi.org/10.1049/el.2013.3022
[6] MicroChip. UHF and Microwave Measurements with the 53100A Phase Noise Analyzer(AN3899).
[7] Andrew Holme. http://www.aholme.co.uk/PhaseNoise/Main.htm
[8] Drew Wollin. https://vk4zxi.blogspot.com/2023/07/an-economical-way-to-measure-phase.html
[9] IW3AUT. http://www.iw3aut.altervista.org/wordpress/?page_id=1570
[10]
Grove, J. et al., "Direct-digital phase-noise measurement," Proc. of
2004 IEEE International Frequency Control Symposium, Montreal, Canada, pp.
287-291, August 2004.
[11] M. M. Driscoll, "Phase noise
performance of analog frequency dividers," in IEEE Transactions on Ultrasonics, Ferroelectrics, and
Frequency Control, vol. 37, no. 4, pp. 295-301, July 1990, doi: 10.1109/58.56490.
[12] https://rubiola.org
[13] https://vk4zxi.blogspot.com/2024/02/pn2060a-ghz-phase-noise-measurement.html
[14] https://scdn.rohde-schwarz.com/ur/pws/dl_downloads/dl_application/application_notes/1gp66/1GP66_4E.pdf
[15] S. R. Stein, "The Allan Variance - challenges and opportunities," in IEEE Transactions on Ultrasonics, Ferroelectrics, and Frequency Control, vol. 57, no. 3, pp. 540-547, March 2010, doi: 10.1109/TUFFC.2010.1445.
[16] Ulrich L. Rohde, Enrico Rubiola, Jerry C. Whitaker. Microwave and Wireless Synthesizers: Theory and Design, Second Edition. John Wiley & Sons, Inc., 2021.
[17] P. De Visme, J. Imbaud, A. Holme and F. Sthal, "Comparison of an Affordable Open-Source Phase Noise Analyzer With Its Commercial Counterpart," in IEEE Transactions on Instrumentation and Measurement, vol. 73, pp. 1-7, 2024.
[18] M. Pomponio, A. Hati and C. Nelson, "Direct Digital Simultaneous Phase-Amplitude Noise and Allan Deviation Measurement System," in IEEE Open Journal of Ultrasonics, Ferroelectrics, and Frequency Control, vol. 4, pp. 160-170, 2024.
[19] https://abracon.com/uploads/resources/NEL-White-Paper-Testing-Phase-Noise-of-Ultra-Low-Phase-Noise-OCXOs.pdf
[20] http://www.stable32.com
END