IN3OTD's web site
...under perpetual construction.

Small PA driver for HF
Under construction...
Small HF PA with BS170; the circuit is the Softrock Ensemble RXTX PA.
All measurement made with Vdc=12.5 V at the DC input jack.
The BS170 used in the PA were selected amongst the 8 devices included in the Softrock Ensemble RXTX kit. The measured Vgs, using the circuit described by Alan, G4FZQ, on his page about BS170 matching were
| BS170 # | 1 | 2 | 3 | 4 | 5 | 6 | 7 | 8 |
|---|---|---|---|---|---|---|---|---|
| Vgs, V | 3.004 | 3.022 | 3.042 | 2.981 | 2.970 | 2.975 | 3.010 | 3.046 |
The MOSFETs used in the push-pull were #5 and #6, while #4 was used for the bias reference (Q5 in the schematic).
The devices bias current was anyway lower than the nominal value; all the other voltages were as expected.
Here is the schematic of the tested PA, which is a section of the Ensemble RXTX schematic. No output filter was used, to allow a direct comparison with the other amplifiers measured previously.

and here is a view of the Ensemble RXTX board partially assembled with the PA circuit:

Measured small-signal S-parameters (with -10 dBm input):
 .
.
The fundamental and harmonics output levels versus input power, with a 10 MHz sinewave input, is shown in the graph below:
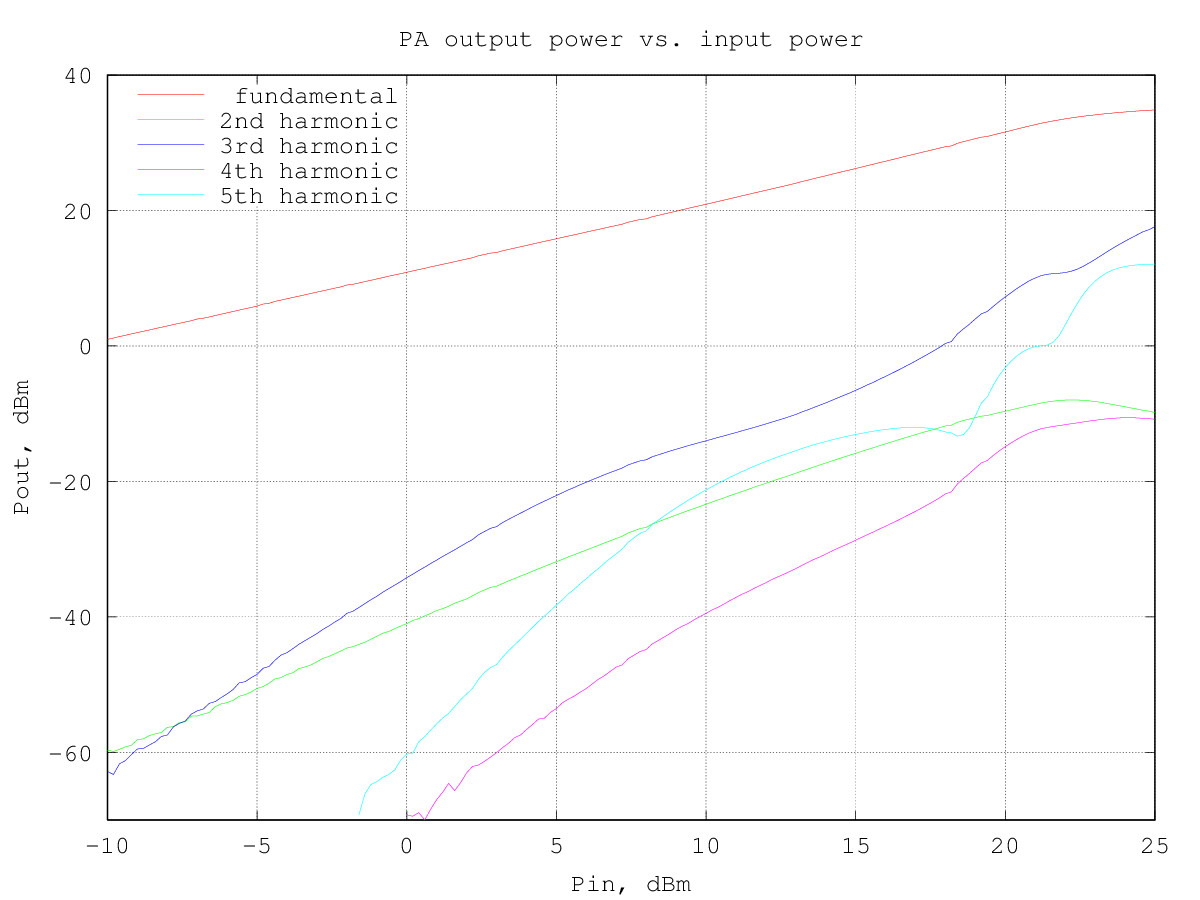
the output power at 1 dB of compression is about 1 W (30 dBm); as typical for class AB amplifiers, just before the output goes into compression there is a slight gain expansion of about 0.5 dB, at around 0.5 W (27 dBm) out..
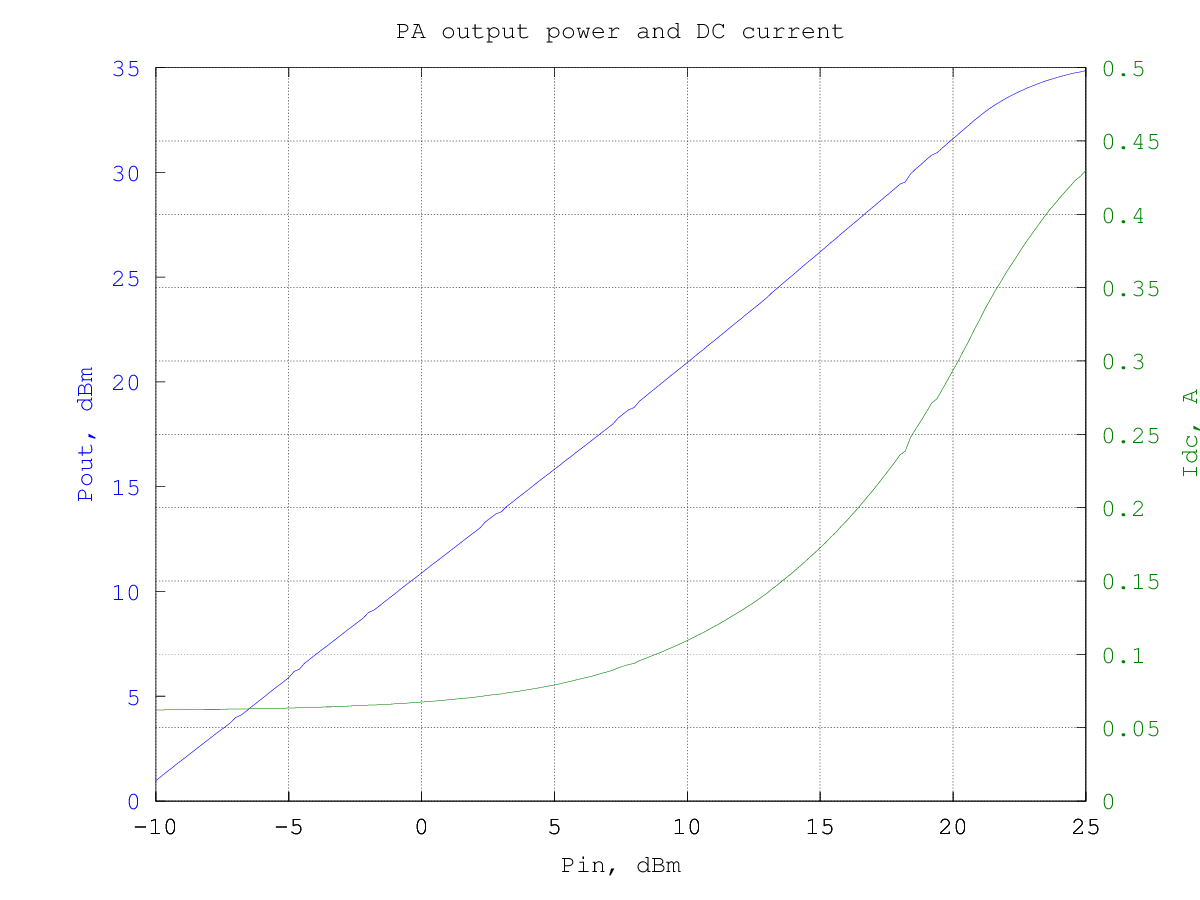
RF output and DC current drawn from the supply versus input power (10 MHz sinewave) are shown in the following graph:
and the resulting efficiency is shown in the graphs below (data are the same for the two graphs, in the first the input and output power are in dBm and in the second they are in watt):
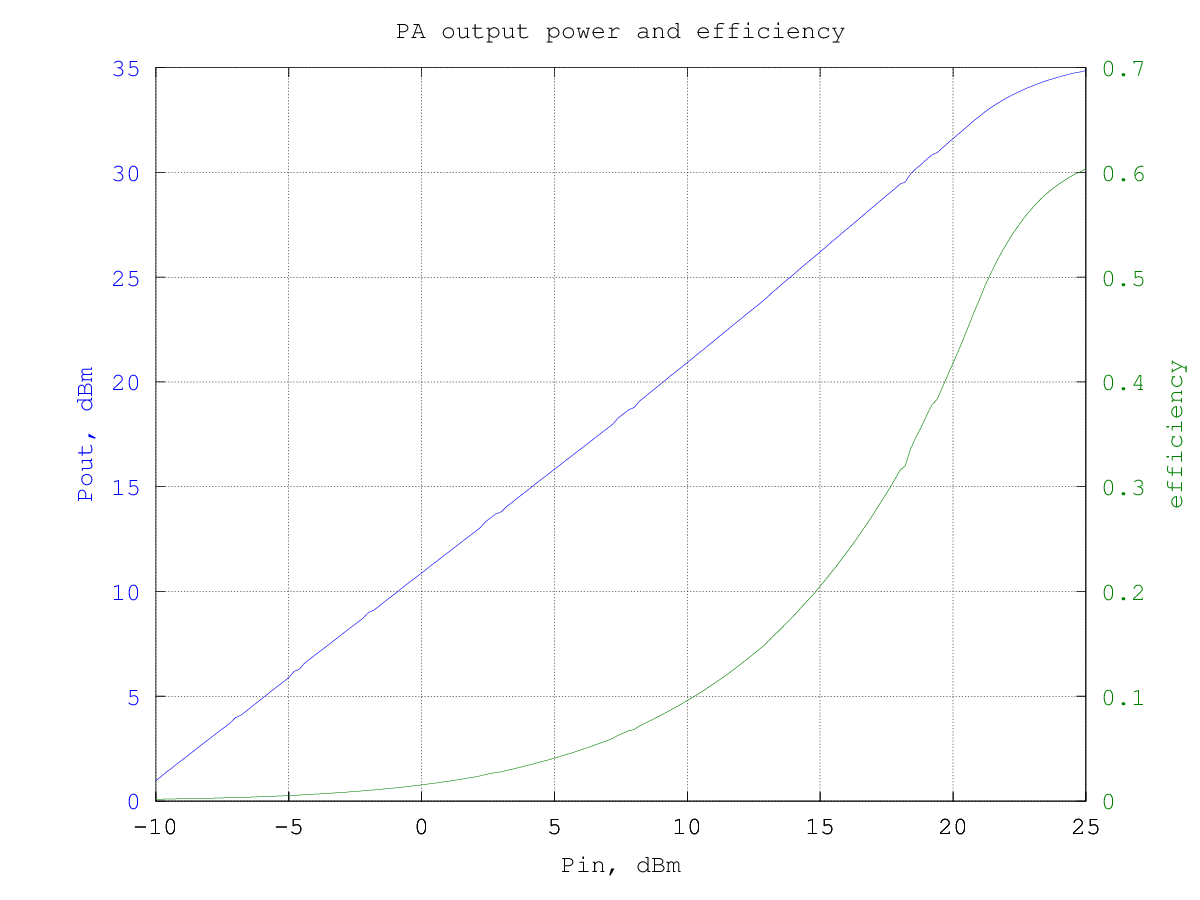
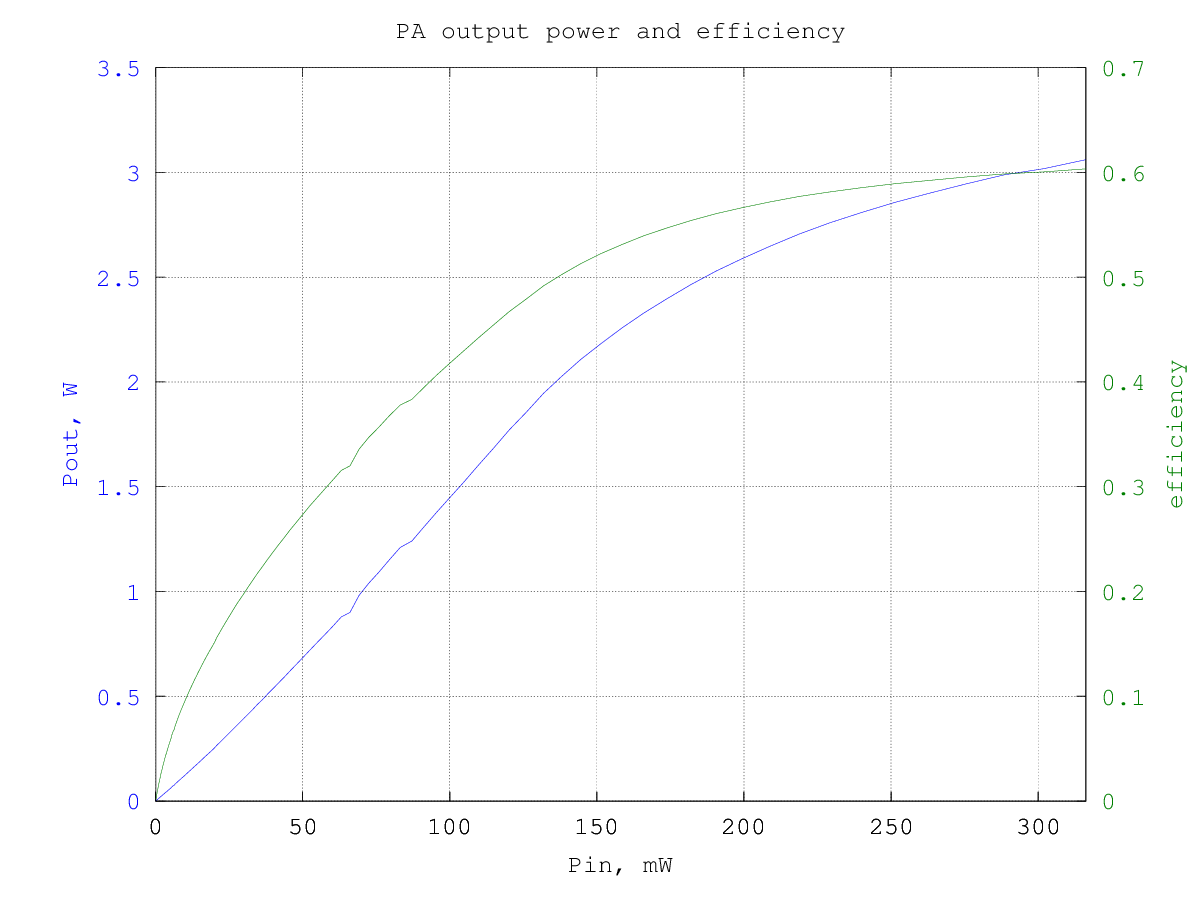
At 1 W out the efficiency is about 35 %, so the power dissipated in the circuit is about 1.8 W, mostly in the two MOSFETs. Note that the BS170 are rated for 600 to 800 mW of power dissipation at 25°C, depending on the manufacturer, so they are likely operated outside their spec limits here.
The third-order intermodulation products amplitude w.r.t the output power per-tone is shown in the graph below (to obtain the actual [average] output power multiply the value by two, to have the PEP, multiply by 4):


note that the IM3 curve is quite non-linear and this allows the IM3 to remain below -30 dBc at power levels until near compression. At an IM3 of -30 dBc the output power is around 700 mW per tone.
The graph below shows the relative amplitude of the IMD products (separately for upper and lower products) for a two-tone test with varying tone spacing at 2.7 W PEP output:

By plotting the third-order intermodulation products power vs. the input power we can find the intercept point by extrapolating the results. The amplifier third-order intermodulation products do not follow the theoretical 3:1 slope w.r.t. the input power, so in this case the IP3 figure is not really meaningful, since it depends on which part of the IM3 products amplitude curve is considered for the calculations:

Just for reference, using the region around an output power of 100 mW (20 dBm), the input IP3 turns out to be 29.5 dBm and the corresponding output IP3 is 40.7 dBm.