NanoVNA-H4 Source Power
Following on from yesterday's CMT R54 source power measurement, today the NanoVNA-H4 source port was measured on the TinySA-Ultra RF spectrum analyzer. Yesterday's R54 measurements were only conducted on one frequency. After reviewing a few internet posts/pages, it appeared that the source power of the NanoVNA-H4 may change depending on what frequency it is tuned to. Thus, more frequencies were tested today (and leading to the idea to re-test the CMT R54 at additional frequencies as a future step).
The NanoVNA-H4 includes a CW frequency menu option in the source control menu. This was used to emit a continuously present, single frequency signal to be measured by the TinySA-Ultra. A photo of the test setup is shown below.
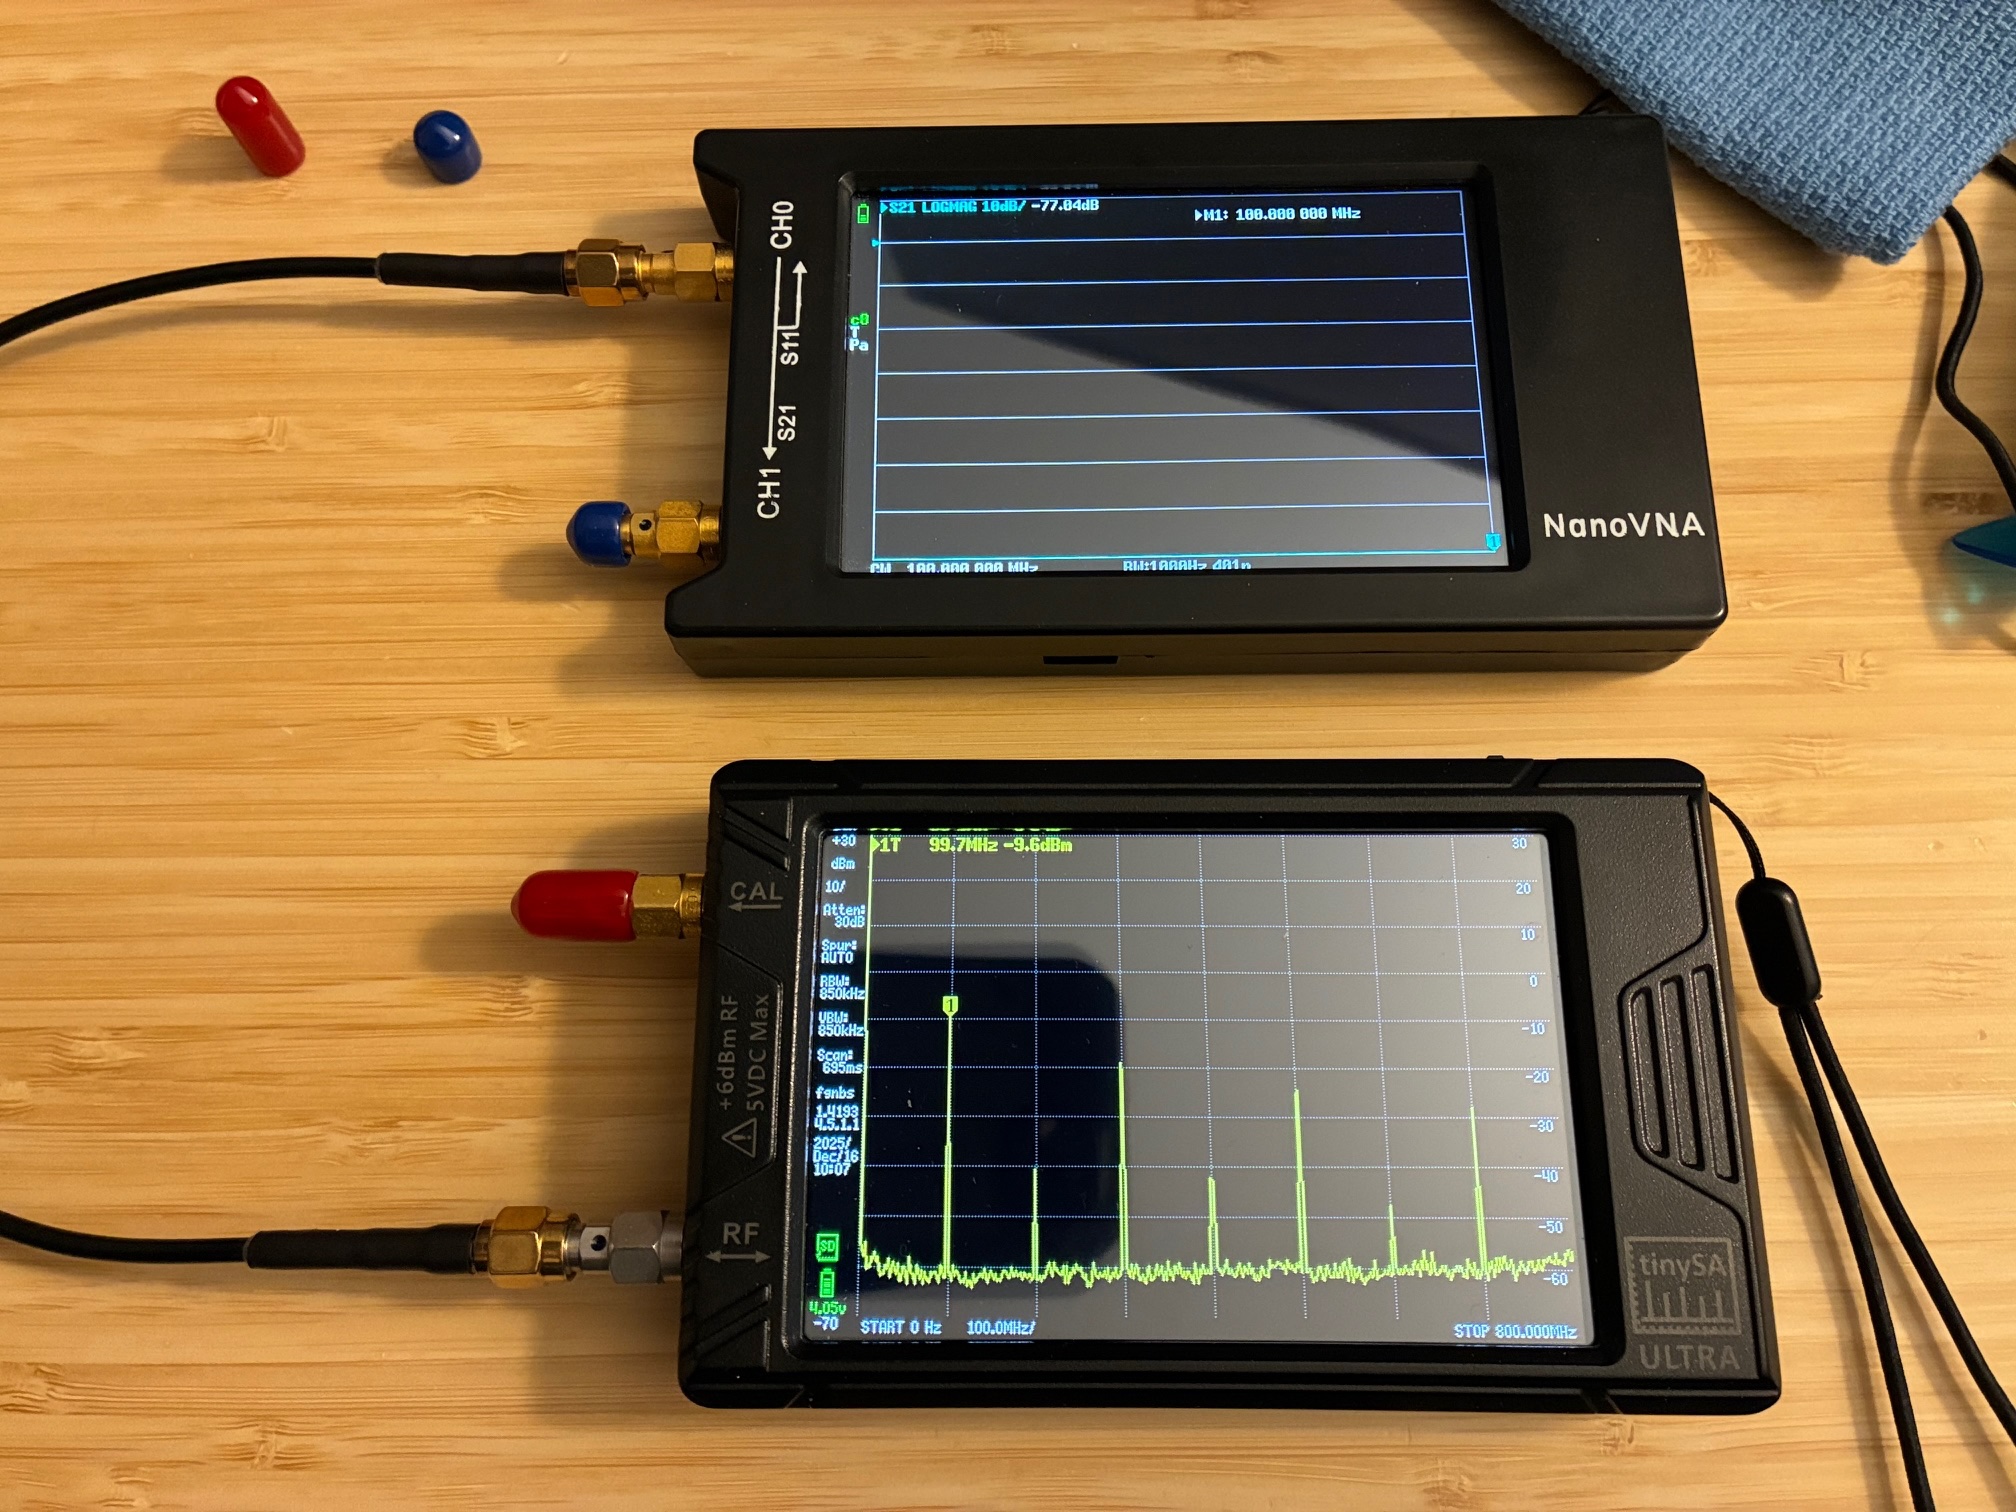
Based upon today's tests, I can confirm that the desired output frequency test signal power level may change depending on the selected test frequency. Below is a table of the measured data:
| Test Freq (MHz) | Meas Pwr (dBm) | Largest Signal | Largest Level | Output Signal |
| 50 | -9.1 | Test freq | Same | Fundamental |
| 100 | -9.8 | Test freq | Same | Fundamental |
| 150 | -3.3 | Test freq | Same | Fundamental |
| 200 | -3.3 | Test freq | Same | Fundamental |
| 250 | -3.4 | Test freq | Same | Fundamental |
| 300 | -3.7 | Test freq | Same | Fundamental |
| 325 | -13 | 108.6 | -3.5 | 3'rd Harmonic |
| 400 | -13 | 133.6 | -3.5 | 3'rd Harmonic |
| 500 | -13 | 166.5 | -3.7 | 3'rd Harmonic |
| 600 | -14 | 199.9 | -3.3 | 3'rd Harmonic |
| 700 | -14 | 233.3 | -3.4 | 3'rd Harmonic |
This test showed that the device uses a square wave output signal, and that at/below 300 MHz, the NanoVNA-H4 output signal frequency is a fundamental signal (plus harmonics) over the device's CW or sweep range. Above 300 MHz, the third harmonic of the output fundamental signal is used for the sweep measurement, but that the fundamental signal (and other harmonics) is present in the output spectrum.
The conclusion from today's test is that there is not an easy answer to how much signal the NanoVNA-H4 puts out for a given frequency range setting. It's probably best to measure it with a spectrum analyzer to ensure you know just what signal(s) are going into your Device Under Test (DUT).
This operates at a harmonic of a fundamental signal approach also points to the need to go back and look at the Copper Mountain Technologies R54 vector impedance probe again to learn if it operates similarly...
All author photos taken with an iPhone 16e.