CMT R54 Vector Probe Source Power - Part 2
A previous source power measurement of the Copper Mountain Technologies R54 vector impedance probe confirmed that it met the specified source power levels of -10 dBm on High and -30 dBm on Low power when measured at 100 MHz. Follow on source power measurements of a NanoVNA-H4 showed that the lower-cost NanoVNA outputs fundamental signals up to 300 MHz, but utilized harmonic outputs above that frequency (while also emitting the stronger fundamental signal at the test port).
Today's question was if the CMT R54 had similar characteristics or if it might always output a fundamental (plus any harmonics) to cover the probe's 85 MHz to 5.4 GHz frequency range.
The same test setup was used for this second measurement, The CMT R54 source was connected to TinySA-Ultra input via a short SMA-SMA cable.
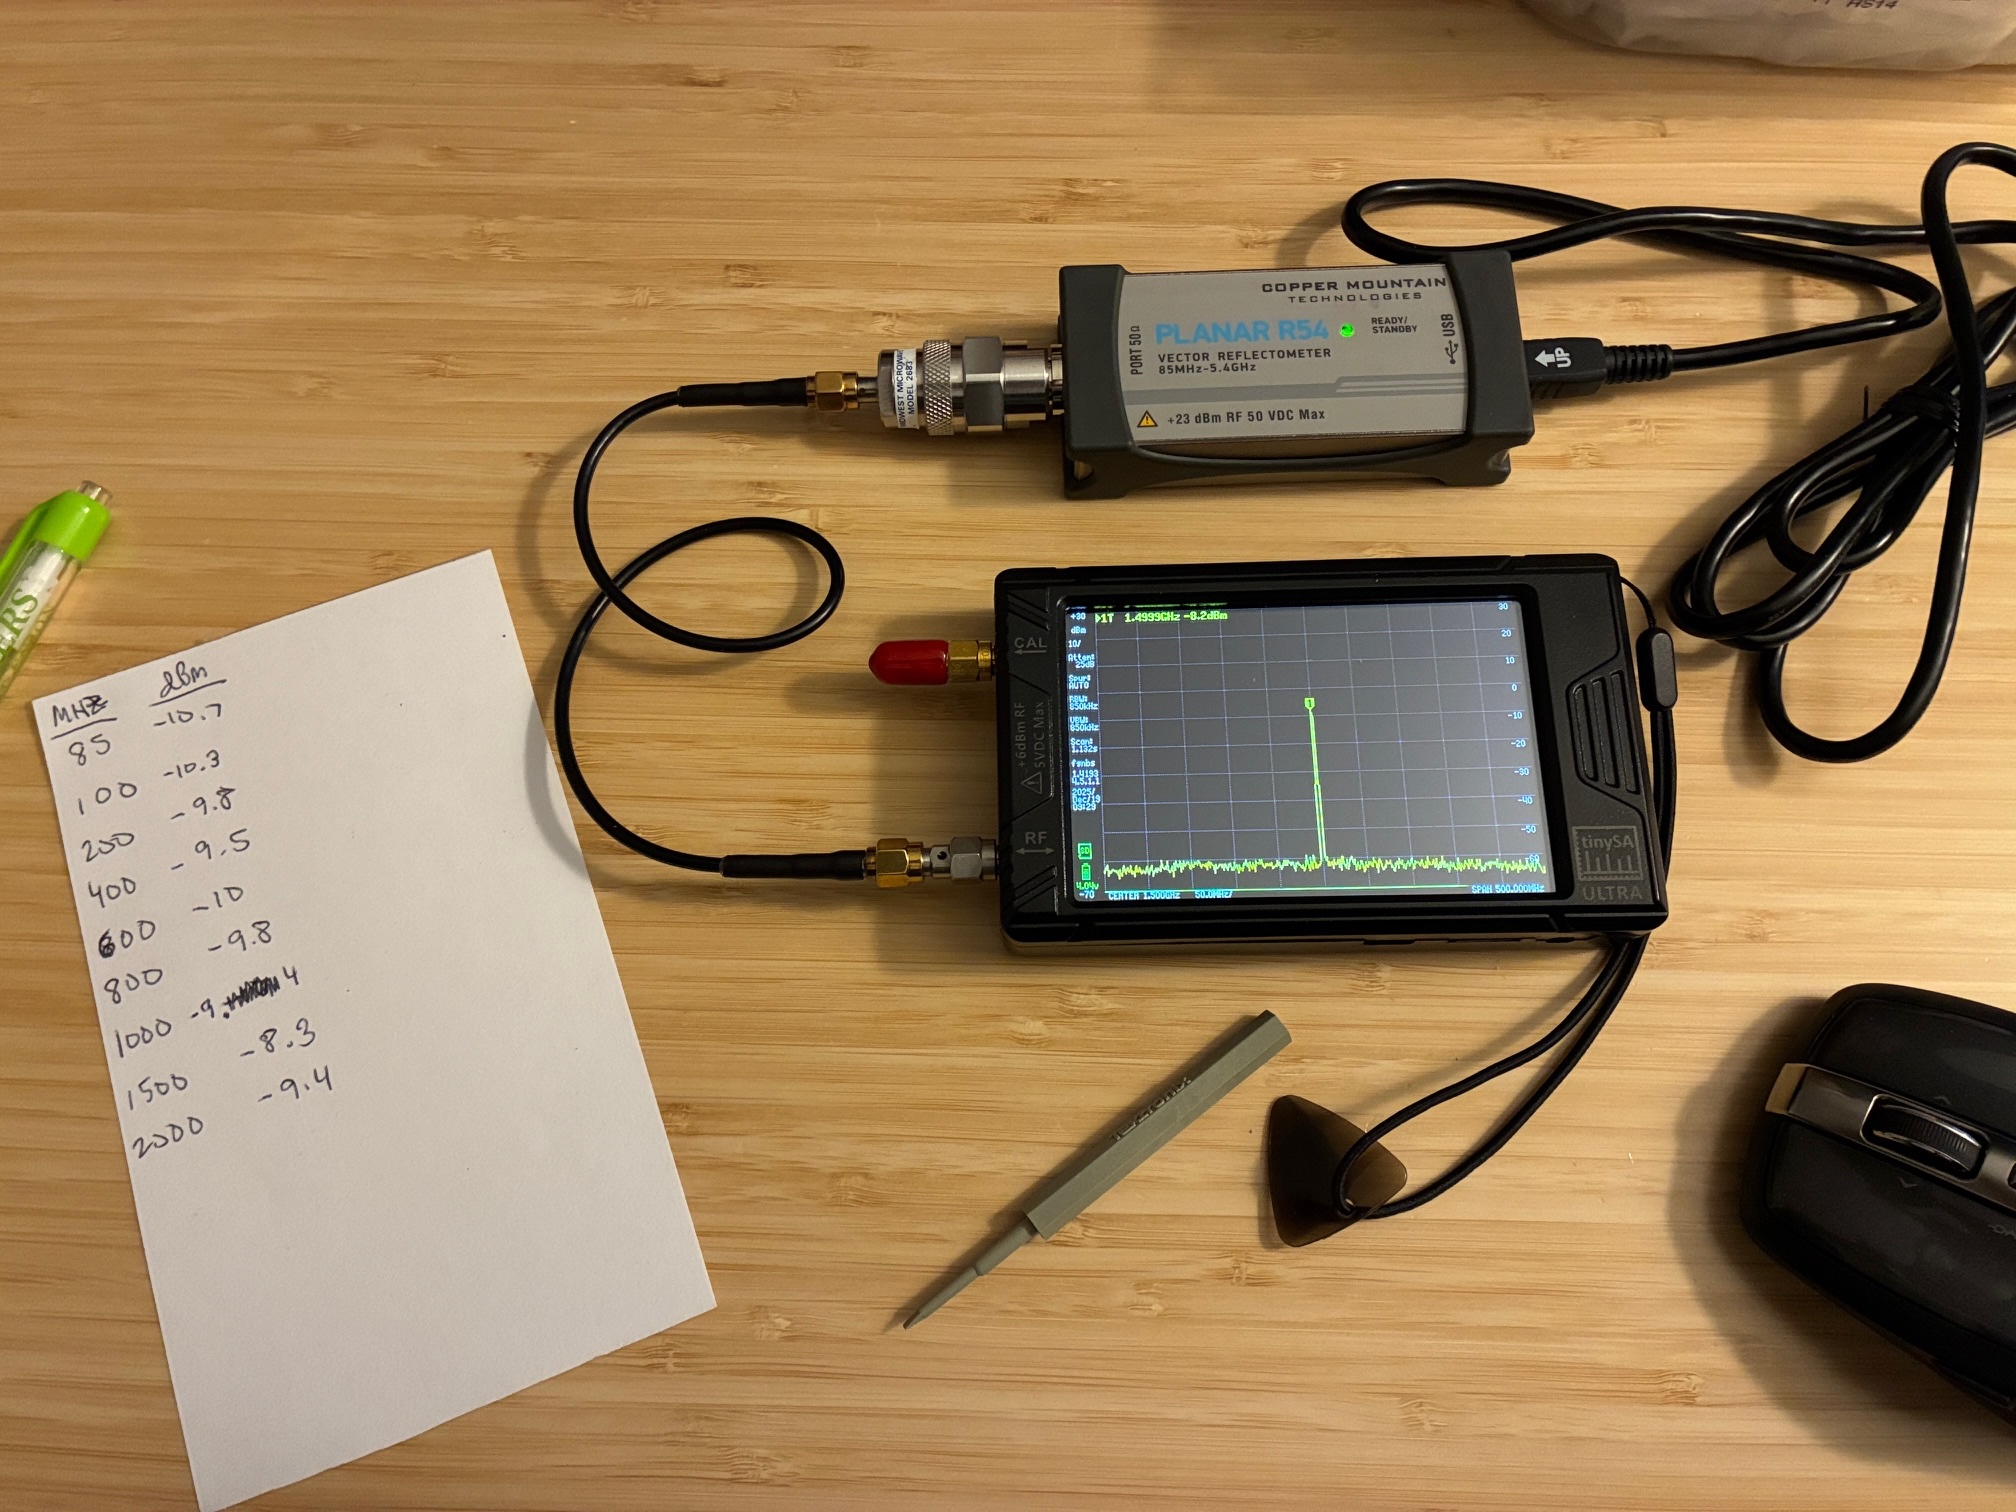
The above photo shows the measurement setup with hand notes for the observed power level (marker readout). Measurements were made on High source power at the R54 (expecting approximately -10 dBm output level).
A series of discrete frequencies and wide-band tests were completed to understand if the CMT R54 was mimicking the inexpensive NanoVNA-H4 mixed fundamental / harmonic outputs depending upon the operating frequency. As it turns out, the ($3,000 USD new cost) CMT R54 does not exhibit the mixed mode (sometimes fundamental, other times harmonics), and instead supplies a fundamental signal at the operating frequency with no lower frequency signals present in the output.
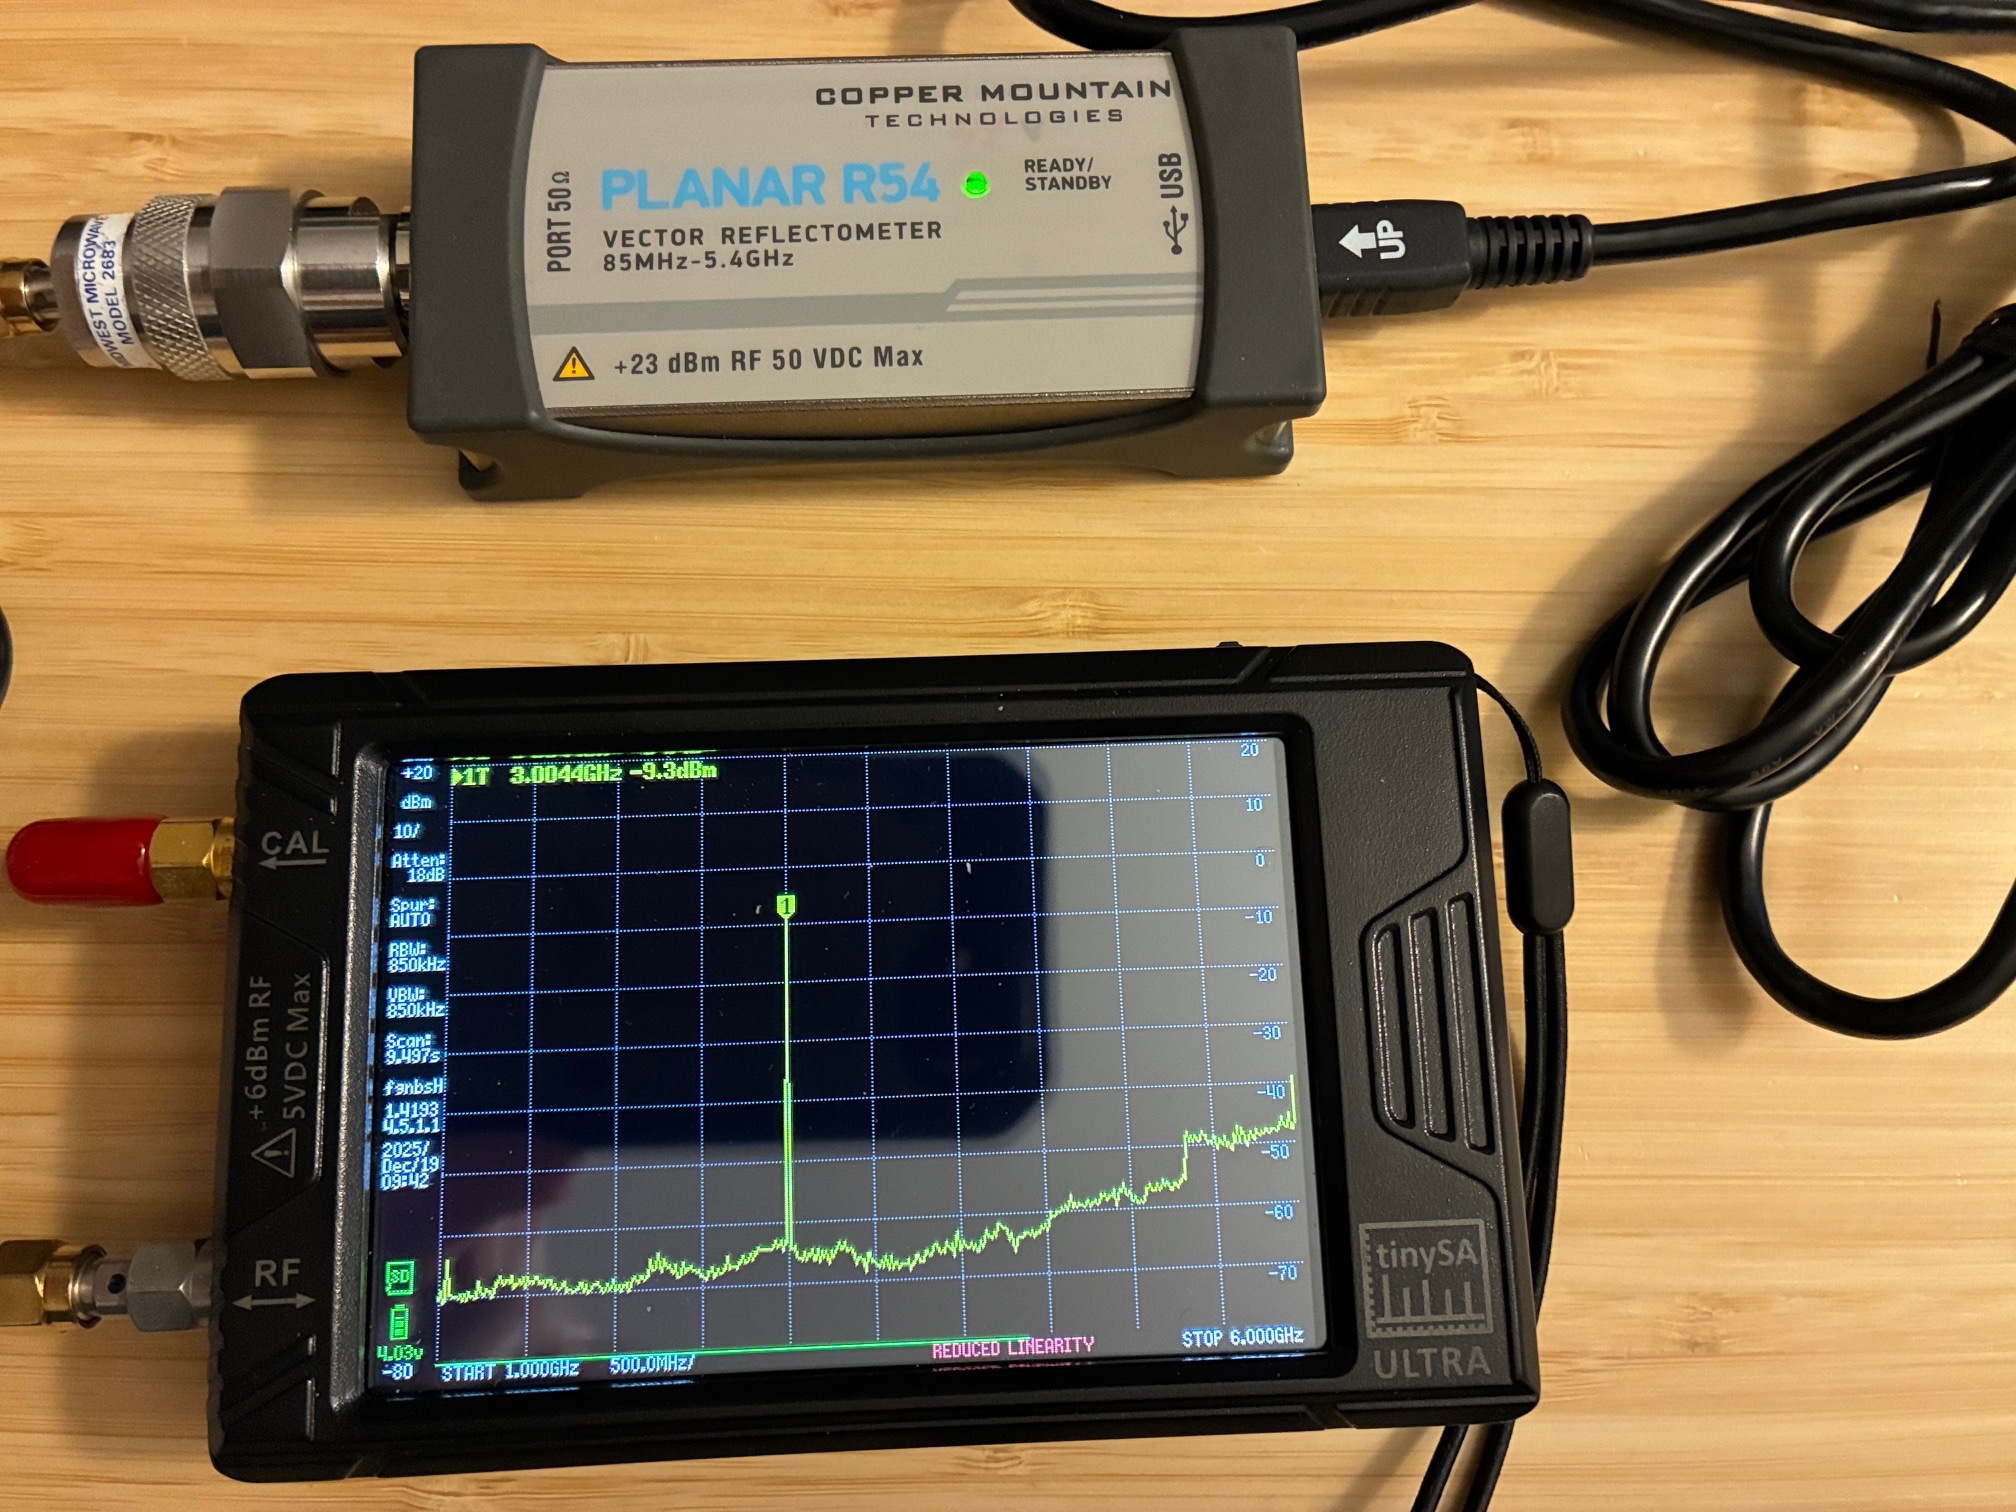
The photo below captures a CMT R54 setting of 3 GHz, with a wide-span TinySA-Ultra sweep from 1 GHz to 6 GHz. No spurious/sub-harmonics/other emissions are present in the captured data.
CMT R54 source settings of 0 Hz or 6.4 KHz span and a sweep time of 10 seconds were used. The TinySA-Ultra was not loop back calibrated prior to these tests (observed levels are considered approximate).
| Frequency (MHz) | Observed Level (dBm) | Notes |
| 85 | -10.7 | |
| 100 | -10.3 | |
| 200 | -9.8 | |
| 400 | -9.5 | |
| 600 | -10 | |
| 800 | -9.8 | |
| 1000 | -9.1 | |
| 1500 | -7.9 | |
| 2000 | -9.1 | |
| 3000 | -10.6 | |
| 4000 | -12.7 | |
| 5000 | -13.5 |
Today's tests confirmed that the source power of the CMT R54 vector impedance probe appears to follow the specified -10 dBm output level, while presenting the fundamental / set frequency as the highest observed output signal. The signal is a square wave, with harmonics present, but they are considerably reduced in amplitude compared to the fundamental output level.
Test Takeaway: Use the CMT R54 with confidence that the source power is controlled and present at the fundamental/test frequency - while keeping in mind that the NanoVNA does not operate similarly.
The carpenter / wood hobbyist's mantra of measure twice, cut once, translates nicely into the electronics hobbyist's similar mantra: know what you're applying from your test instrument before making measurements with it.
All author photos taken with an iPhone 16e.